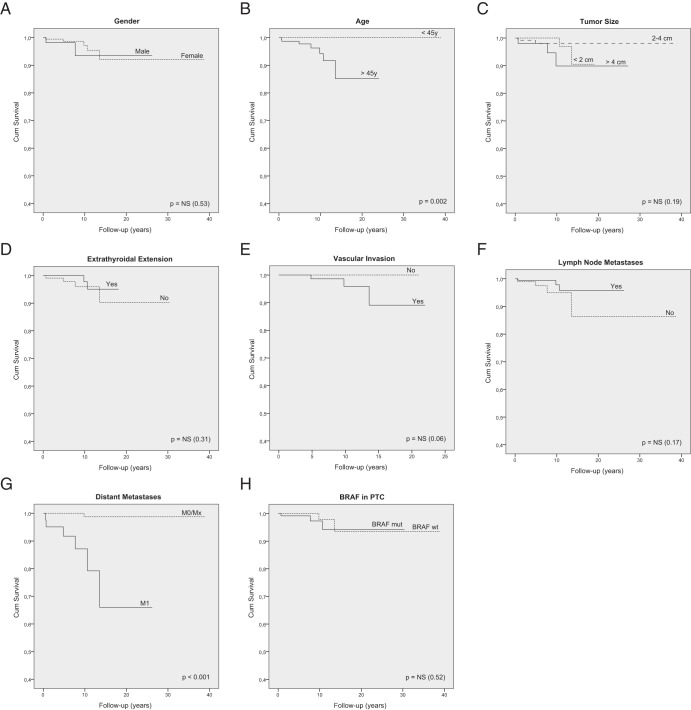
Figure 2.
Kaplan-Meier survival curves of DTC-specific survival according to the different clinicopathological and molecular features: gender (A), age (B), tumor size (C), extrathyroidal extension (D), vascular invasion (E), lymph node metastases (F), distant metastases (G), and BRAF status in PTCs (H).

