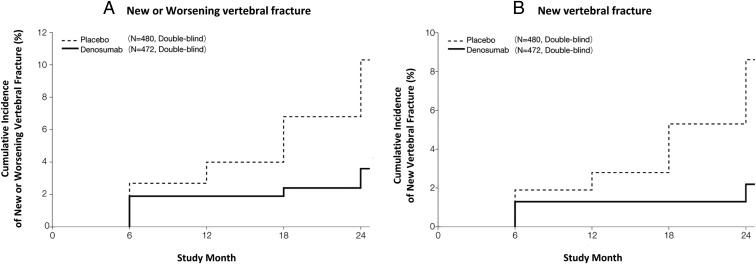
Figure 2.
Cumulative incidence of vertebral fracture. The cumulative incidence of new or worsening vertebral fracture (A) and new vertebral fracture (B) in all subjects in the denosumab and placebo groups. For panels A and B, the percentages given were incidence by the Kaplan-Meier estimate over a 24-month treatment period. The HR (95% CI) and P value of new or worsening vertebral fracture (A) for the denosumab vs the placebo group was 0.343 (0.194, 0.606) and P = .0001. The HR (95% CI) and P value of a new vertebral fracture (B) for the denosumab vs placebo group was 0.260 (0.129, 0.521) and P < .0001. In the subgroup analysis in men at 24 months, the incidence of new or worsening vertebral fracture in the denosumab and placebo groups was 0% and 12.5%, respectively, and that of new vertebral fracture in the denosumab and placebo groups was 0% and 8.3%, respectively. The P value of a new or worsening vertebral fracture and new vertebral fracture for the denosumab vs placebo group was P = .0748 and P = .1478, respectively. The HRs (95% CI) were not estimated because there were no subjects with a vertebral fracture in the denosumab group.

