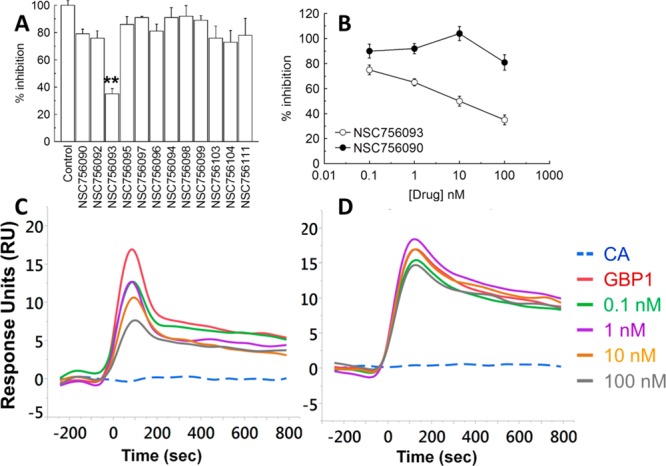
Figure 2.

(A) Bar chart showing the % of inhibition of the 12 compounds capable of producing an inhibition of the GBP1:PIM1 interaction >10% at a drug concentration of 100 nM. The maximum signal (100%) was obtained in the absence of any compound. Bar and error bars refer to mean and SD of duplicated experiments. (B) Line chart reporting the dose dependent growth inhibition of NSC756093 and NSC756090. Each dot and bar refer to mean and SD of duplicated experiments. (C,D) Representative biosensograms for NSC756093 (C) and NSC756090 (D). CA (dotted line) represented the negative control while GBP1 (red line) the maximum signal without inhibitor.
