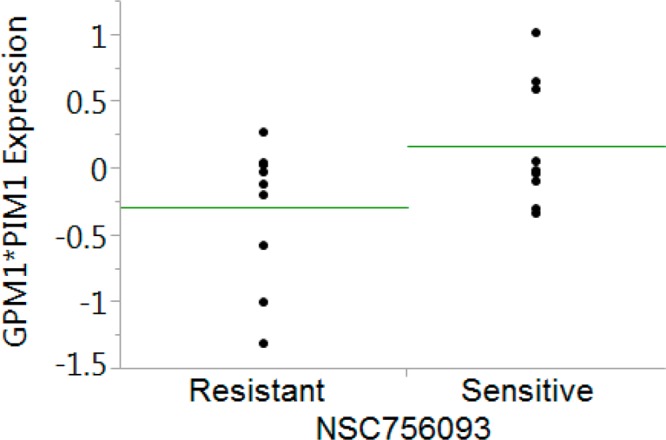
Figure 4.

Analysis of PIM1/GBP1 gene expression and NSC756093 sensitivity. Median gene expression values (Z-score) for GBP1 and PIM1 were downloaded and combined in an index of expression. Green line corresponds to the average of each group. This index was significantly lower in the cells resistant to NSC756093, as compared with the NSC756093-sensitive cells (p = 0.01, t test).
