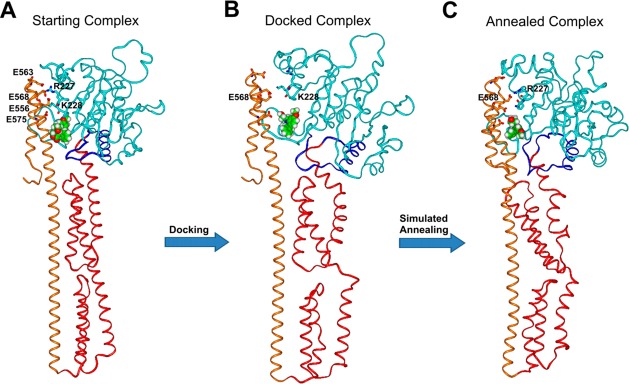
Figure 8.

Overall view of NSC756093/GBP1 starting (A), docked (B), and annealed (C) complexes. GBP1 structure is displayed as ribbons, where the LG domain is in cyan, the connecting region in blue, the helical domain in red and α12/α13 in orange. NSC756093 is displayed as CPK and colored by atom type (C = green, O = red, N = blue, H = white). Key interacting residues between LG domain and α12/α13 are displayed in stick, colored by atom type and labeled.
