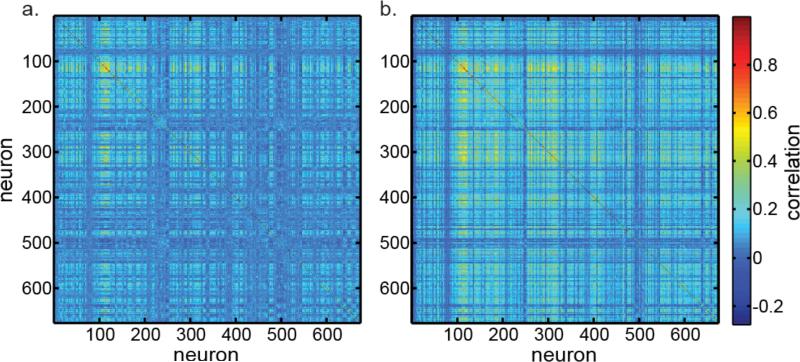
Figure 5.
Correlation matrices of neural responses for 674 neurons in the data set. a. Correlation matrix for the original data. Mean absolute correlation is 0.063. The dimensionality for these data is 52, as shown in Figure 4. b. Correlation matrix for data that has been mathematically transformed to increase neural correlations, in order to examine effect on dimensionality. Mean absolute correlation doubled to 0.126. The increased correlation caused a slight decrease in dimensionality from 52 to 48.

