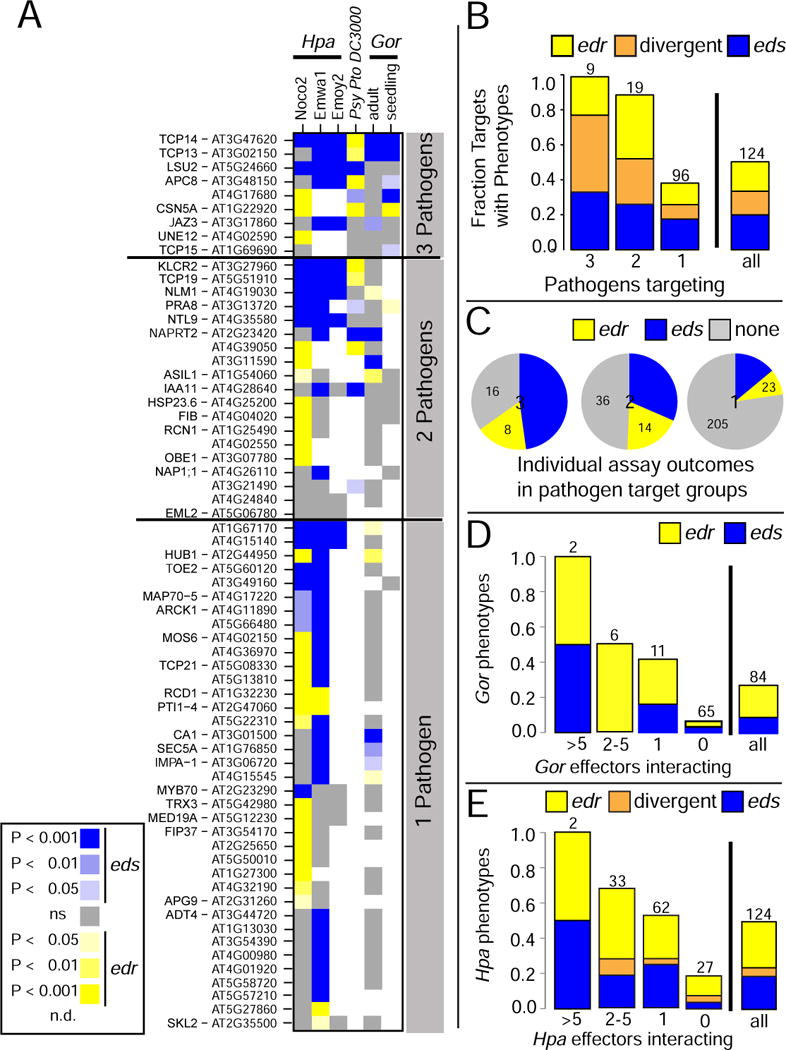
Figure 3. Phenotypic characterization of effector-interactor mutants.

A. Heat-map summarizing the outcome of phenotypic analyses of mutants in genes encoding the indicated effector-interactors in infection assays with the noted pathogens and developmental stages. Host proteins are sorted by the number of pathogens interacting with them, then by number of observed phenotypes and performed assays. Mutant lines for 59 proteins interacting with effectors from a single pathogen did not show any disease phenotype and are not shown. Refer to Table S3 for raw data for all phenotyped loci and Figure S3 for complete results for all tested lines. B. Fraction of mutant lines for proteins interacting with effectors from the indicated number of pathogens that exhibited an edr, eds or divergent phenotypes across the assays. C. Pie chart representation of the phenotype density; the number of observed phenotypes relative to individual assays performed for that group. Each pie displays data for proteins that interacted with effectors from the number of pathogens given in the center. D. Fraction of mutant lines for proteins targeted by the indicated number of Gor effectors for which edr or eds phenotypes were observed. Numbers above bars indicate the number of targets in that class. E. As in D, but for proteins targeted by the indicated number of Hpa effectors for which edr or eds phenotypes were observed. Numbers above bars indicate the number of effector-interactors in the class.
