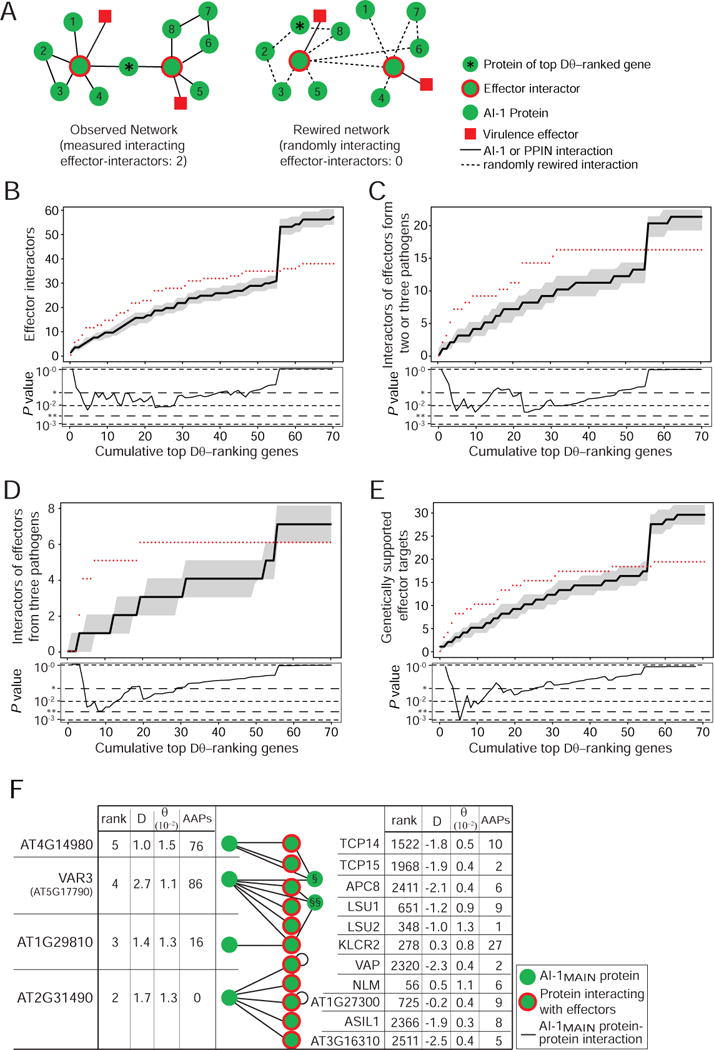
Figure 5. Proteins with high natural genetic variation interact with effector-interactors.

A. Schematic illustration of the analysis in B–E: in the AI-1MAIN network (left) the effector-interactors directly interacting with top Dθ-ranking gene products are counted and compared to the distribution of counts observed in 1,000 randomly rewired networks (single example shown). Effectors are shown for illustration only and not included in the analysis. B. Analysis as described in A. Plotted along the Y-axis are cumulative counts of effector-interactors interacting with proteins encoded by the top Dθ-ranking × genes. Data from AI-1MAIN are shown as red dots, the black line shows the median of 1,000 randomly rewired networks, grey shaded areas show the 25th and 75th percentiles of values from rewiring controls. The lower panel shows the corresponding experimental P values (* 0.05; ** 0.005). The steep rise in the simulations at x = 56 is caused by a high-degree protein (NLM1, AT4G19030) at that position; the many rewired interactions for this protein increase the count of random interactors in all categories. C. As in B but counting proteins interacting with effectors from two or three pathogens. D. As in B but counting proteins interacting with effectors from three pathogens. E. As in B but counting proteins whose mutation caused altered immune phenotypes. F. Among the 13 interaction partners of the five most selected proteins are eleven effector-interactors, including the five most targeted proteins. The tables show for all top Dθ-ranking proteins and effector-interactors the relative combined rank, DT, θW and the count of AAPs. The non-effector-interactor interactors of the variable proteins are § AT1G51580 and §§ ZPF7. See also Figure S5 and Table S5.
