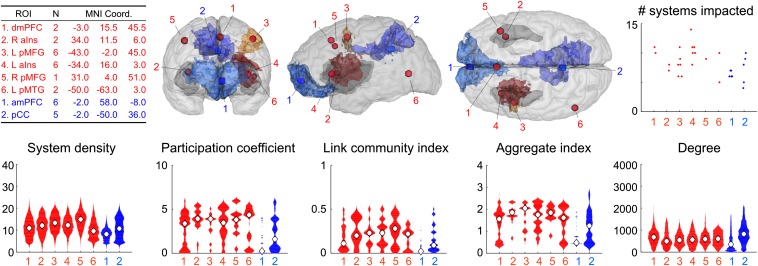
Fig. 3.
Target and control ROIs, location, and network properties. (Upper, Left) Descriptions of each ROI, number of patients, and MNI 152 coordinates of each location. (Center) Target and control ROIs (red spheres and blue boxes, respectively) superimposed on the lesion-mapping template brain (in glass brain format) viewed from several perspectives (from left to right: frontal, left lateral, and dorsal). The cerebral cortex is shown in light gray, and the insular cortex is shown (bilaterally) in darker gray. The remaining colored portions of the figures indicate the lesion overlap of the two target and two control ROIs that were sampled most often. The illustrated degree of lesion overlap was selected on a per-group basis to best reflect the common portion of that group’s brain damage; for the four groups, the degree of lesion overlap depicted is as follows: left posterior middle frontal gyrus (L pMFG), 4 (n = 6); left anterior insula (L aIns), 5 (n = 6); amPFC, 5 (n = 6); pCC, 3 (n = 5). Lesions at each individual target and control location are shown in Fig. S3. (Right) Damage to several functional systems is evident in both groups (see also Fig. S5). (Lower) Violin plots of the network properties of the tissue sampled by the lesions, binned by lesion location. The participation coefficient is the measure that best distinguishes target and control locations.

