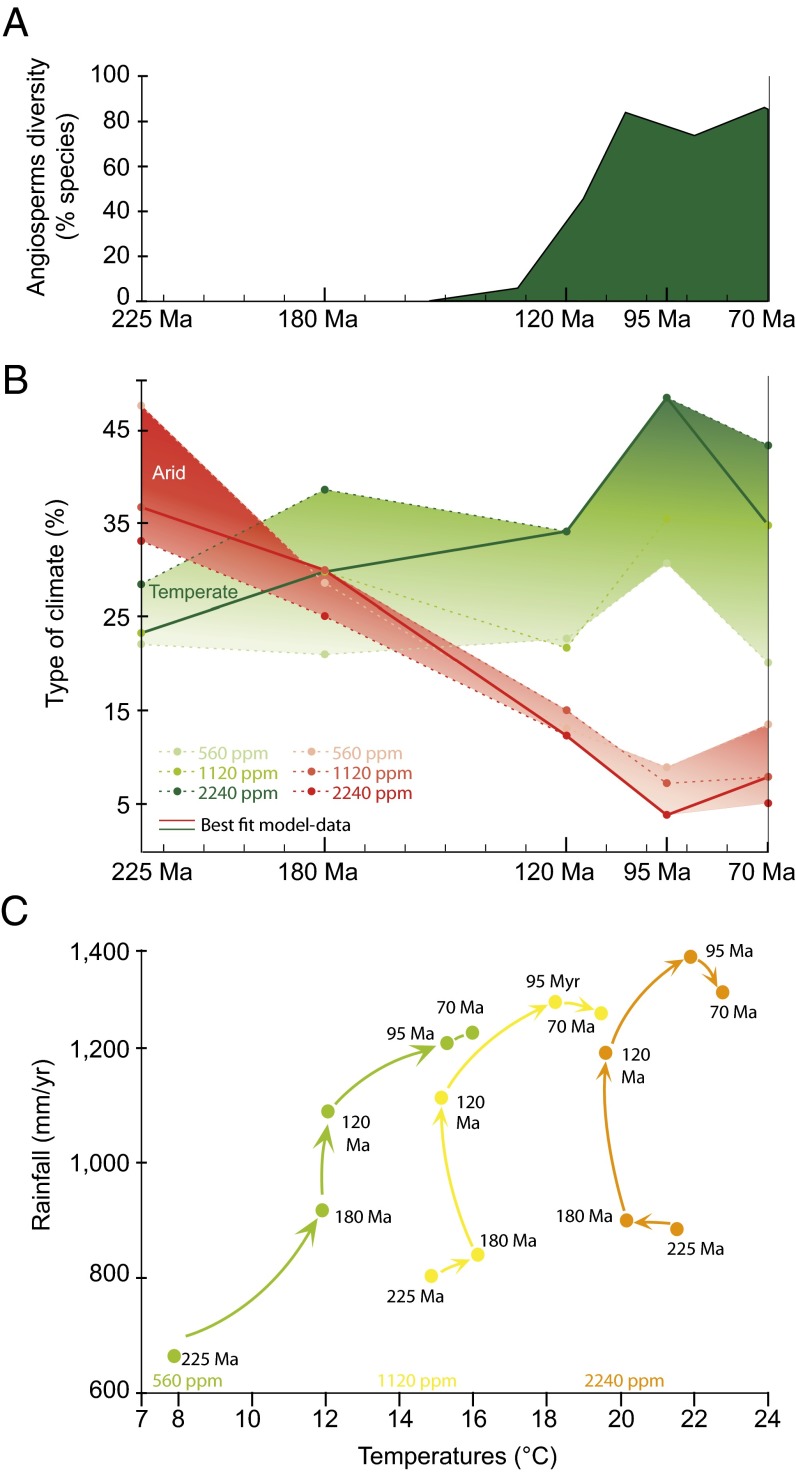
Fig. 1.
Relationship between rainfall, temperatures, simulated biomes, and angiosperm diversification during the Mesozoic. (A) Evolution of angiosperm diversity during the Mesozoic [from de Boer et al. (10)] showing the rapid rise of diversity in the Early Cretaceous and the high values for the Cenomanian (95 Ma). (B) Evolution of desert surfaces and temperate biome fractions during the Mesozoic for the three pCO2 scenarios (560, 1,120, and 2,240 ppm) and five paleogeographies. Biomes were defined from the PFTs defined in the LPJ scheme (Table S2). The temperate biome fraction is considered as the sum of the three LPJ temperate woody PFTs and the herbaceous temperate PFT. Solid lines indicate the scenarios retained as the best-fitting with paleoclimatic data (Supporting Information). (C) Global continental mean air temperature (°C) and rainfall (mm/y) simulated by FOAM-LPJ with a pCO2 of 560 ppm (green), 1,120 ppm (yellow), and 2,240 ppm (orange). From the Triassic (225 Ma) to the mid and Late Cretaceous, precipitations highly increase. For all values of pCO2 the Triassic (225 Ma) and Jurassic (180 Ma) are the driest simulations, and the Cenomanian (95 Ma) and Maastrichtian (70 Ma) are the wettest. The Early Cretaceous (120 Ma) is pivotal with the onset of humid and hot conditions.

