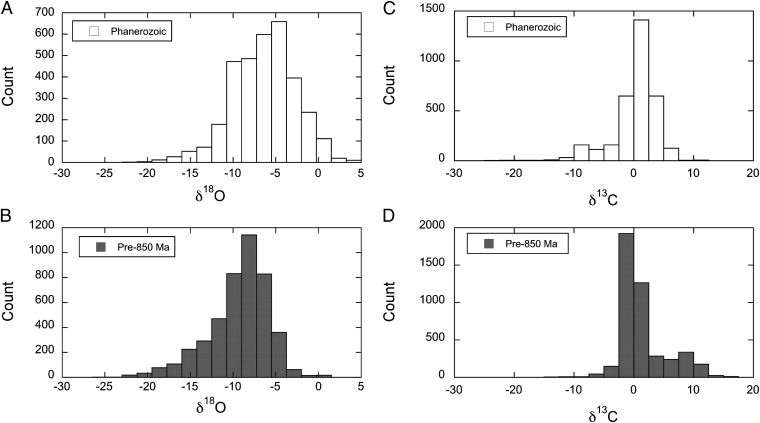
Fig. 1.
Histograms showing the distribution of δ18O and δ13C values for altered marine carbonate rocks deposited before 0.85 Ga (B and D, respectively) and during the Phanerozoic (A and C). The oxygen isotope distributions (A and B) are similarly shaped although the pre-850-Ma distribution has a stronger negative skewness (−0.86 vs. −0.32 for the Phanerozoic) and is shifted toward the left (lighter values), reflecting the higher degree of alteration of these rocks. The carbon isotope distributions (C and D) contrast markedly, with the pre-850-Ma skewness positive (0.79) but shifted slightly to the left (lighter values) and the Phanerozoic skewness negative (−1.6), a reflection of the larger negative tail of 13C-depleted isotope values in post-Neoproterozoic rocks. Data from ref. 5. Note that the analyses of Neoproterozoic rocks younger than 850 Ma are excluded from these figures to highlight the contrast between more ancient and “postgreening” diagenetic effects and avoid the complications of the anomalous values associated with Neoproterozoic glaciation.

