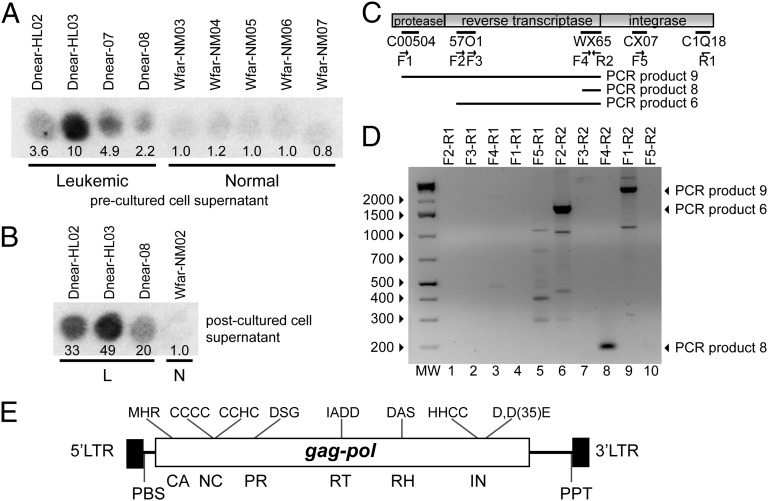
Fig. 1.
RT activity and isolation of Steamer DNA from hemolymph of leukemic M. arenaria. (A) RT activity in cell-free hemolymph of indicated leukemic or normal M. arenaria animals was determined by assay for incorporation of {32P}dTTP onto a homopolymer substrate (23). Spot intensity reports the yield of labeled DNA synthesized in vitro, quantitated by ImageJ and normalized to the average of normal values. (B) Hemocytes from the indicated animals diagnosed as leukemic or normal (L or N) were cultured in vitro, and RT activity present in the postculture supernatant medium was determined as in A. (C) Alignment of selected sequences obtained by deep sequencing of cDNAs from a leukemic clam with a retroviral pol gene. PCR primers, forward (F) and reverse (R), are indicated. DNAs amplified by various primer pairs are indicated below the element diagram. (D) DNAs amplified in PCR reactions using cDNA obtained from leukemic clams as a template. Major amplified products are indicated by arrows at the right. (E) Schematic of Steamer genome annotated with characteristic retroelement features. The 5′ and 3′ LTR and the locations of the coding sequences for CA (capsid), NC (nucleocapsid), PR (protease), RT, RH (RNaseH), and IN (integrase) domains are indicated. Characteristic sequence features of each domain, and predicted primer binding site (PBS) and polypurine track (PPT) are indicated.

