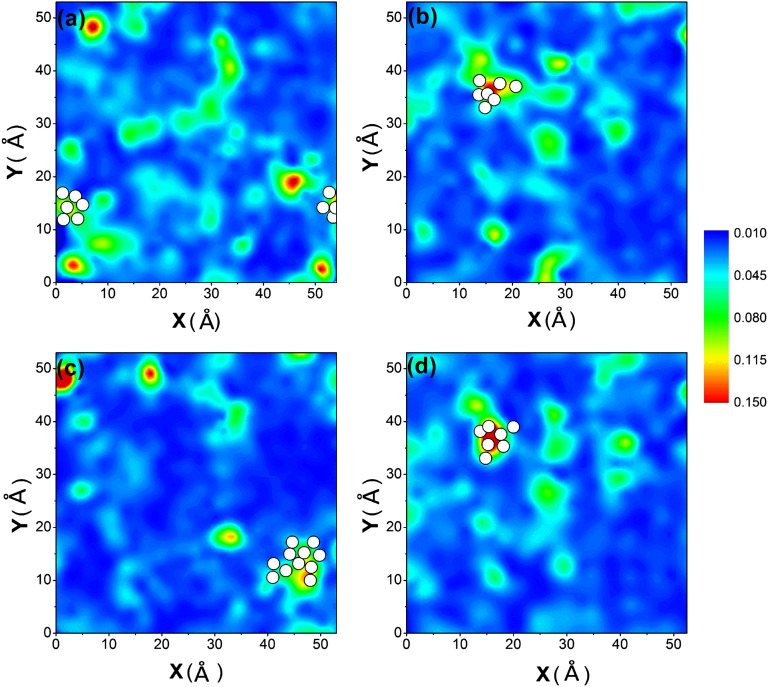
Fig. 4.
Contoured maps showing the spatial distribution of participation fraction Pi (see sidebar) for Cu and Zr atoms in the Cu64Zr36 metallic glass with the cooling rate of 109 K/s. The four sampled representative thin slabs (A–D) each has a thickness of 2.5 Å. White spots superimposed in the maps mark the locations of atoms that have experienced clear shear transformations (Methods) under AQS to a strain of 5%.

