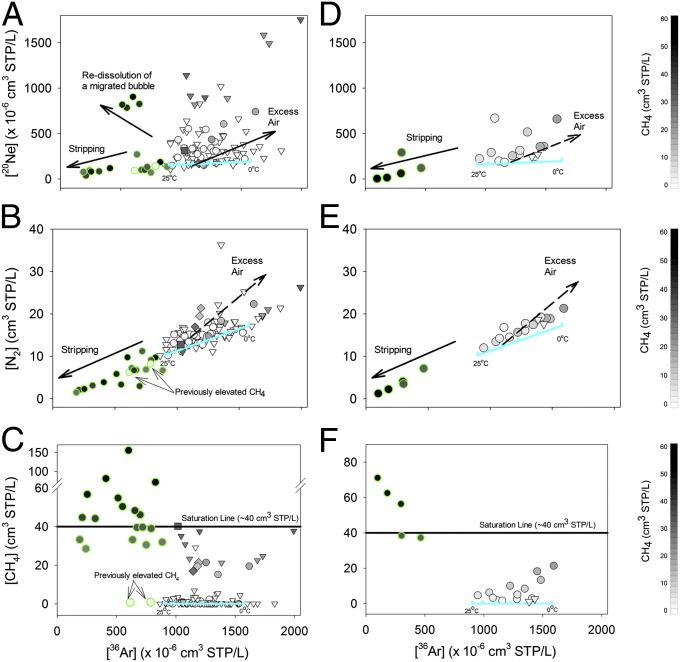
Fig. 3.
20Ne (Top), N2 (Middle), and CH4 (Bottom) vs. 36Ar in the MSA (Left) and BSA (Right) at distances >1 km (triangles) and <1 km (circles) from drill sites. All normal trend samples have 36Ar and N2 within 15% of the temperature-dependent ASW solubility line (cyan lines). Conversely, a subset of wells with elevated [CH4] <1 km from drill sites (green-rimmed circles) shows significantly stripped ASW gases (20Ne, 36Ar, N2), which result from extensive partitioning of dissolved ASW gases into a large volume of migrating gas-phase hydrocarbons (i.e., a fugitive gas). Note that domestic wells labeled previously elevated CH4 were vented to remove methane from the water before our sampling. Consistent with the MSA, most BSA samples (15 of 20) also have normal ASW composition, but five anomalous samples, including the two that displayed pronounced changes between the initial and later sampling events (Fig. S5), have significantly stripped ASW gas composition (green-rimmed circles).

