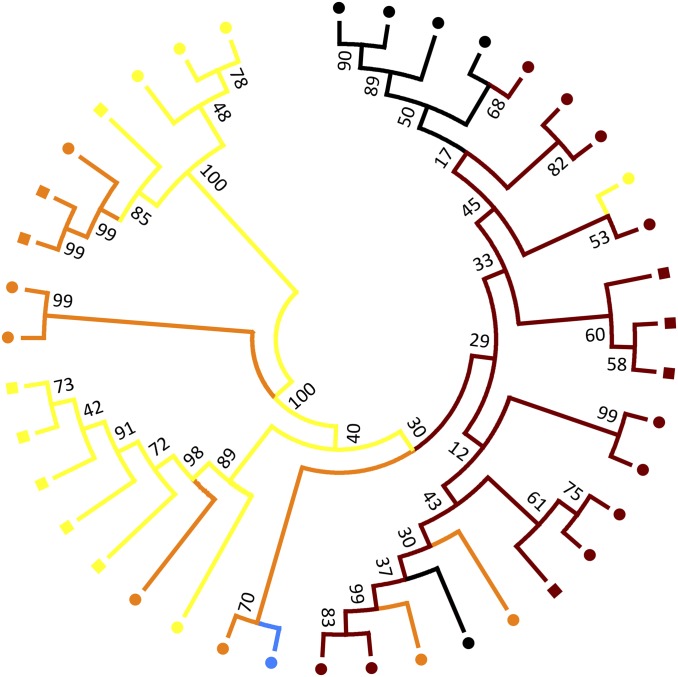
Fig. 3.
Maximum-likelihood phylogenetic tree based on an ∼1,629-nt region of the BFDV genome (support values represent a percentage from 1,000 bootstrap replicates). Colors indicate P. elegans subspecies (see Fig. 1), and shapes indicate evidence of recombination (square = recombination detected, circle = no recombination detected).

