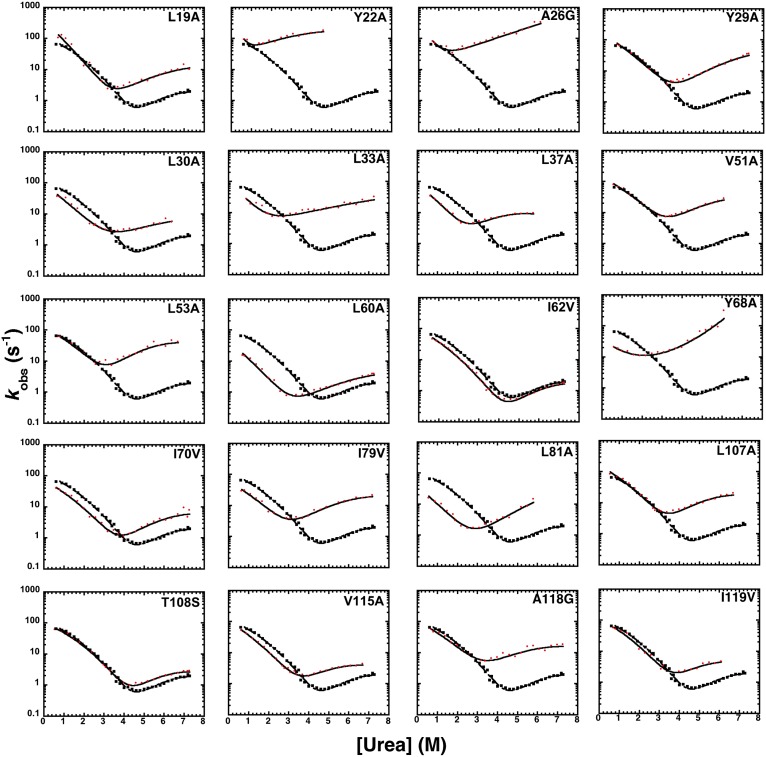
Fig. 1.
Chevron plots of wild-type (black filled squares) and mutants (red filled circles) of frataxin. Rate constants were measured as a function of urea at pH 7, with 0.4 M Na2SO4, and at 25 °C. All of the chevron plots were obtained by using a stopped-flow apparatus. Lines are the best fit to a model involving a broad free energy barrier, fitted globally to a quadratic equation with a global mtotal value as previously described (17, 19).

