Fig. 2.
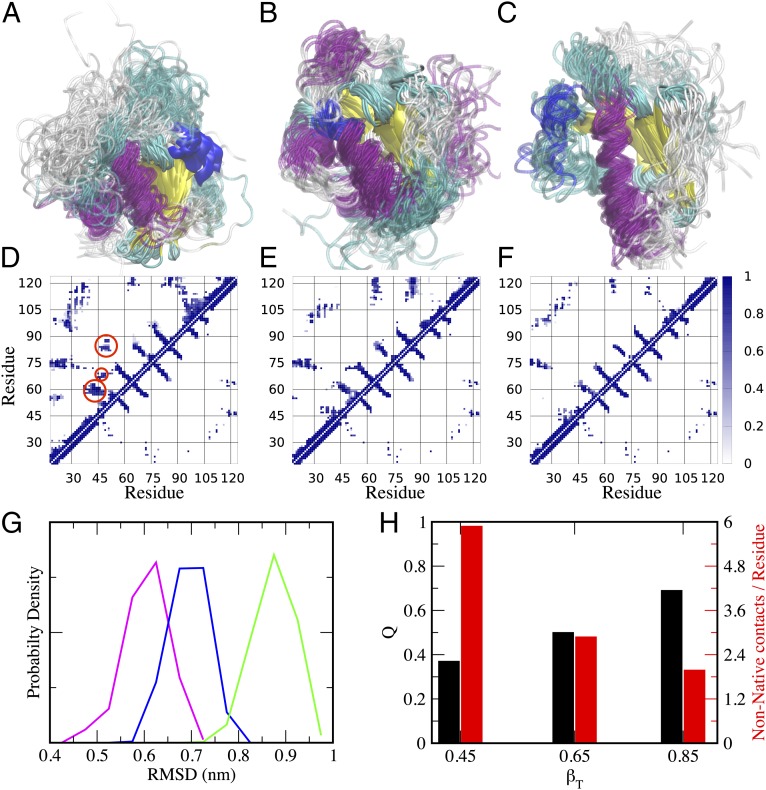
Folding transition state ensembles of frataxin. (A–C) Structures obtained by restrained molecular dynamics simulations at βT = 0.45, βT = 0.65, and βT = 0.85, respectively. (D–F) Contact maps of the corresponding transition states compared with the native state. In each contact map, the bottom right triangle refers to the contacts in the native state, whereas the top left refers to the transition state. The misfolded regions, which are clearly evident in the early transition state at βT = 0.45 (highlighted by red circles), were used to design the second round of mutagenesis. (G and H) Structural properties of the three transition states, including (G) the rmsd from the native state (βT = 0.45, green; βT = 0.65, blue; βT = 0.85, purple) and (H) the fraction of native contacts Q and nonnative contacts.

