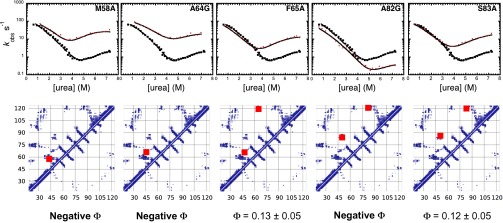
Fig. 3.

Validation of the transition state ensembles of frataxin via a second round of mutagenesis. Chevron plots of the wild type (black filled squares) and five single-residue mutants (red filled circles). Rate constants were measured as described in Fig. 1 (see also Materials and Methods). Lines are the best fit to a model involving a broad free energy barrier. The contact map for the early transition state (βT = 0.45) is reported below each plot and the contacts that are affected by the mutation are indicated with red squares.
