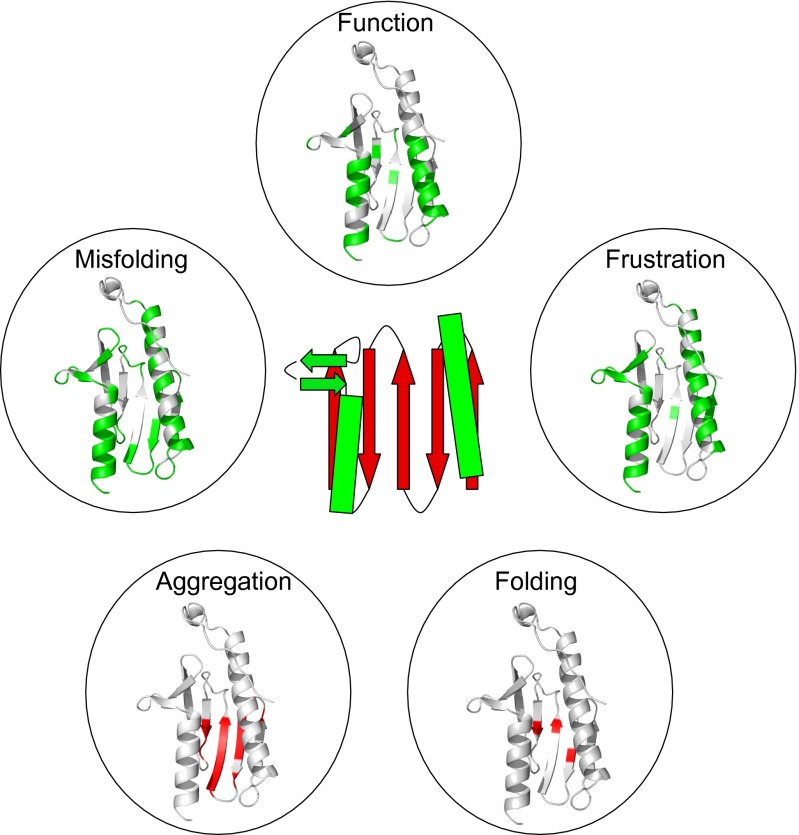
Fig. 4.
Relationship between function, misfolding, frustration, and aggregation propensity in frataxin. A schematic diagram of the structure of frataxin is reported at the center. Function: The key residues involved in the function of frataxin, as detected from the binding to ferrochelatase, are highlighted in green on the structure; residues correspond to those identified in Fig. 3 of ref. 14. For completeness, the negatively charged residues involved in metal binding in frataxin are reported in Fig. S7. Misfolding: To identify on the structure the regions that are mainly involved in the transient misfolding, we highlighted in green the residues with more than 50% nonnative interactions in the early transition state of βT = 0.45; frustration was calculated from the web server www.frustratometer.tk (22) and residues forming highly frustrated interactions are reported in green (see also Fig. S1). Folding: The three residues (L60, I70, and L81) with the highest Φvalues are highlighter in red; these residues are identified as those most important for folding (21). Aggregation propensity: The aggregation propensity was calculated at a residue level using the Zyggregator algorithm (40, 41) and mapped on the structure; residues displaying a high propensity to aggregate are represented in red.

