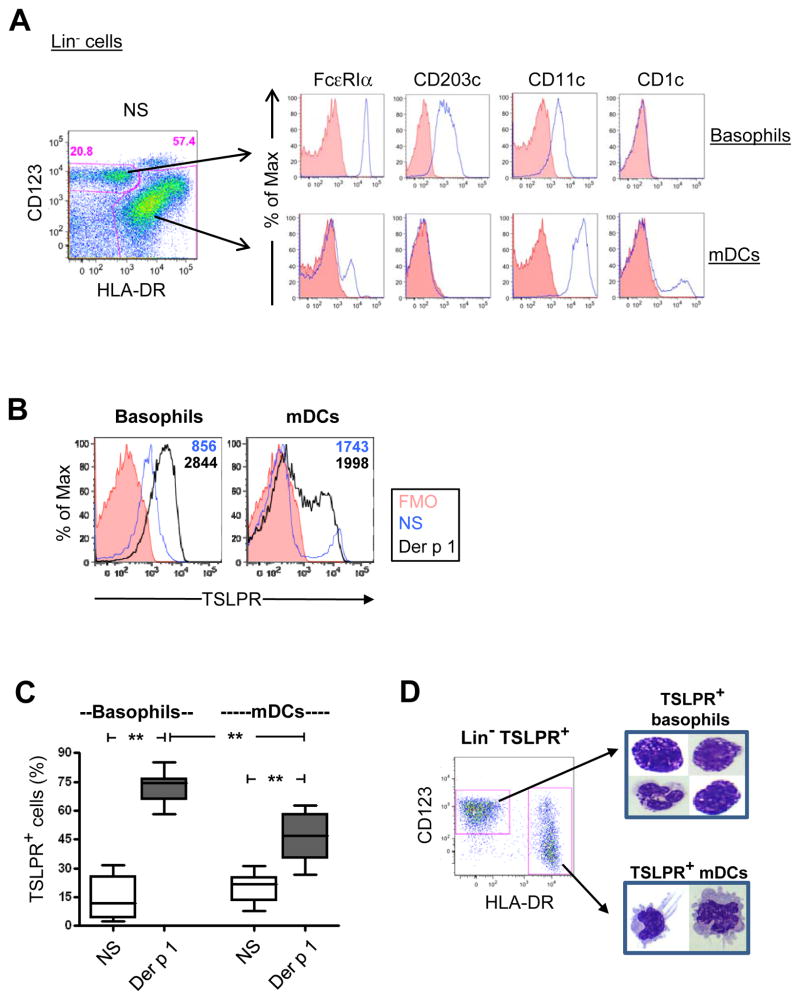
Figure 2. TSLP Receptor is Induced on Atopic Basophils.
(A) Phenotype of basophils and DCs within the Lin− subset (representative of 10 asthmatics). FMO, fluorescence-minus-one control. (B & C) Representative data (B) and summary data (C) for 13 atopic subjects showing the change in percentage of TSLPR+ basophils and DCs with allergen stimulation. (D) Microscopy of sort-purified TSLPR+ basophils and myeloid DCs using Wright-Giemsa staining (representative of 2 atopic subjects). Box plots represent median and interquartile ranges. **p<0.01.

