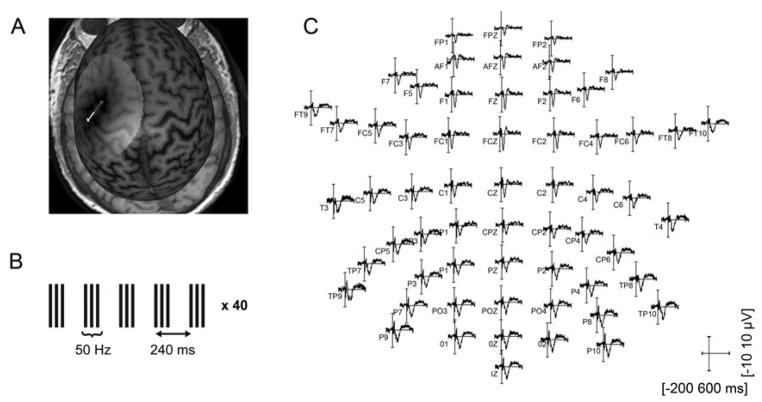
Figure 1.
Illustration of the experimental procedures. A. Illustration of the left M1 targeted with single-pulse TMS and with the cTBS intervention on an individual MRI. B. Illustration of the cTBS intervention: 200 triplets at 50 Hz, separated by 200 ms (inter-stimulus interval of 240 ms). C. Illustration of TMS-evoked time-domain EEG activity at all electrodes for all trials in one participant.

