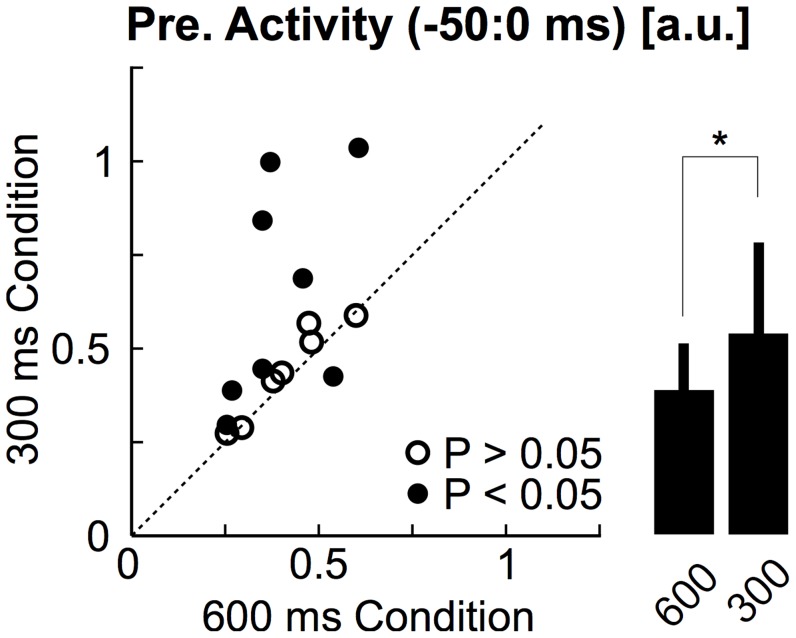
Figure 4. Effect of timing condition on muscle co-activation.
Average pre-perturbation activity (from −50 ms to 0 ms) in the 300 ms condition plotted against the pre-perturbation activity in the 600 ms condition. Filled dots designate participants for whom the change in pre-perturbation activity was significant (Wilcoxon ranksum tests on individual trials, P<0.05). Open dots represent participants who did not display any significant change in pre-perturbation activity. The bar plot summarizes the effect of the timing condition on the pre-perturbation activity (mean ± SD across participants). The star indicate significant increase (one-tail paired t-test, P<0.05).

