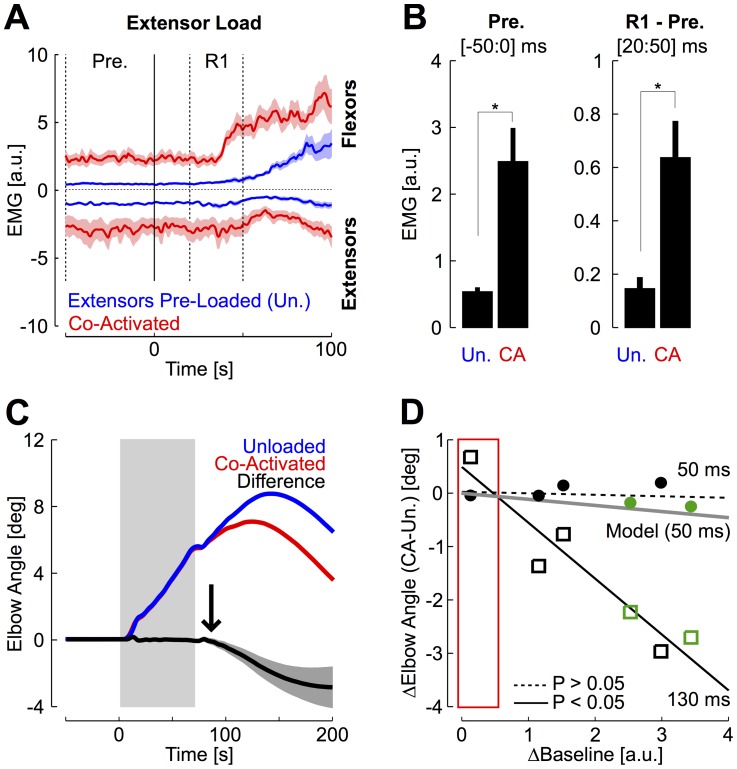
Figure 6. Effect of co-activation.
A: Muscles activity averaged across groups and participants in the two conditions of muscle pre-activation following an extensor perturbation load evoking flexor response (red: co-contraction; blue: unloaded). Shaded areas are the standard error across participants. The two epochs are illustrated with vertical dashed lines (Pre.: −50 to 0 ms, R1: 20 to 50 ms) B: (Left) Changes in pre-perturbation activity across conditions when the antagonist muscle group is pre-loaded (blue, unloaded), or when muscles are co-activated (red). (Right) Difference between the muscles activity in the short-latency time window (R1: 20–50 ms) and the pre-perturbation activity. C: Elbow motion averaged across participants with similar color code as in panel 6A. The difference is plotted in black and the gray area represents the standard error of the mean across participants. The vertical rectangle illustrates the perturbation time window as in Figure 3. The vertical arrow indicates the onset of divergence estimated based on sliding t-test (∼85 ms). D: Changes in elbow angle as a function of change in co-activation for individual subjects. Filled dots are the average diference in elbow angle measured at 50 ms and open squares are the average difference in joint angle measured at 130 ms. The red rectangle illustrates the range of spontaneous changes in co-activation from the main experiment. The two participants illustrated with green symbols are those for whom activation-dependent changes in joint angles occurred prior to 20 ms (see Methods).

