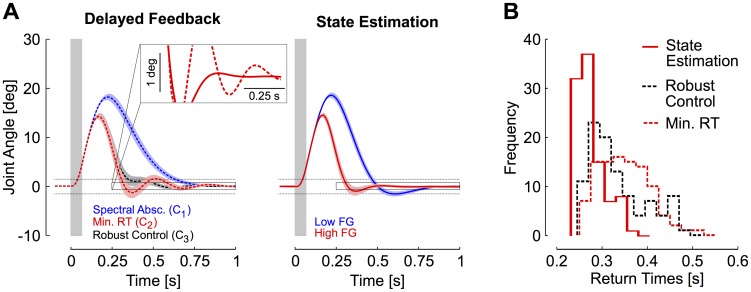
Figure 8. Simulations results.
A: Simulations of feedback responses following perturbations with delay-uncompensated control (left) and feedback control based on state estimation (right). Dashed horizontal traces illustrate the virtual target and the shaded rectangle represents the perturbation duration. Feedback responses obtained with the three delay-uncompensated candidate controllers are represented: minimum spectral abscissa (blue, C1), minimum return time (red, C2), and maximum stability radius (robust control, black, C3). Responses of the controller based on state estimation are displayed for two distinct cost-functions illustrating the effect of increasing the feedback gains on the overall response profiles (high feedback gains, red, or low feedback gains, blue). Areas represent a standard deviation across 100 simulation runs at each point in time. B: Distributions of return times obtained with the delayed controllers (dashed) and with state estimation (solid red).

