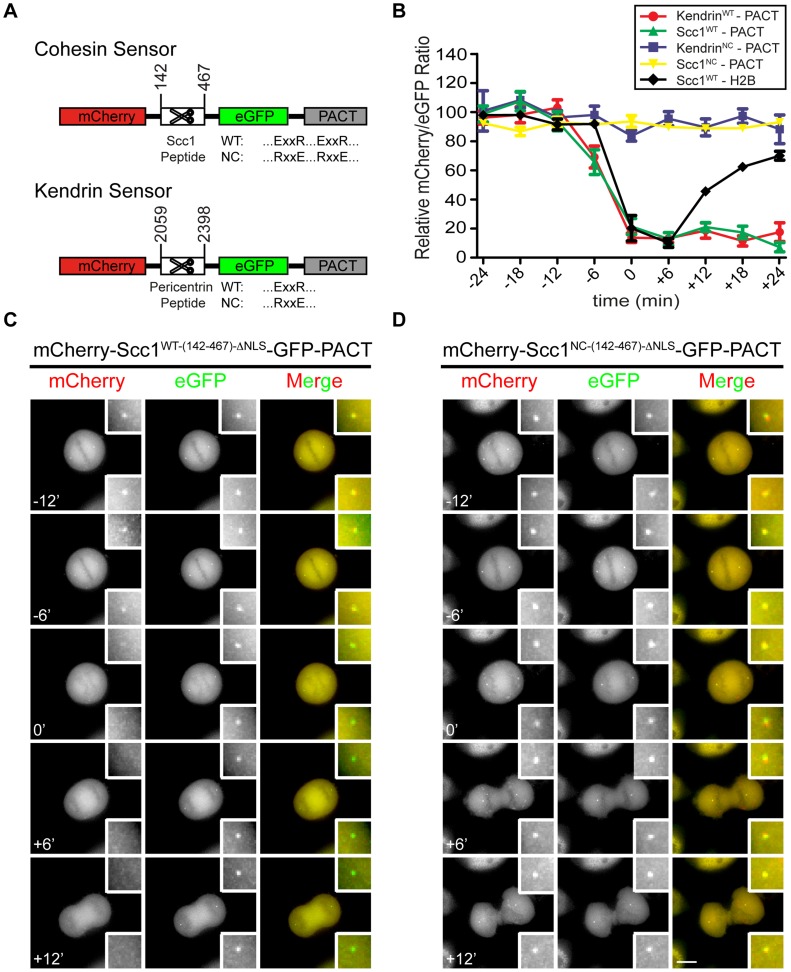
Figure 1. Construction of separase sensor constructs for centrosomes.
(A) The architecture of the centrosomal Scc1 and kendrin sensors. (B) Relative intensity plots of the mCherry/eGFP ratio for the following centrosomal signals: mCherry-Scc1WT-(142-467)-ΔNLS-eGFP-PACT (n = 18), mCherry-Scc1NC-(142-467)-ΔNLS-eGFP-PACT (n = 20), mCherry-KendrinWT-(2059-2398)-eGFP-PACT (n = 27), and mCherry-KendrinNC-(2059-2398)-eGFP-PACT (n = 11). In addition, H2B-mCherry-Scc1(142-467)-eGFP (n = 10) at chromatin was analyzed for separase activity; for H2B sensor, eGFP/mCherry ratio was used and plotted as described in materials and methods section. The ratio of mCherry/eGFP was normalized to the average of the first two data points (time = −24 min and −18 min) in order to assess cleavage rates. Time t = 0 indicates anaphase onset. The error bars are SEM. (C, D) The mCherry-Scc1WT-(142-467)-ΔNLS-eGFP-PACT (C) and mCherry-Scc1NC-(142-467)-ΔNLS-eGFP-PACT (D) sensors stably integrated into the FRT locus of HeLa T-REx cells were followed every 6 min. Time t = 0 min indicates anaphase onset. Representative images are shown. Insets show the two-fold enlarged centrosomal signals. Scale bar: 10 µm.

