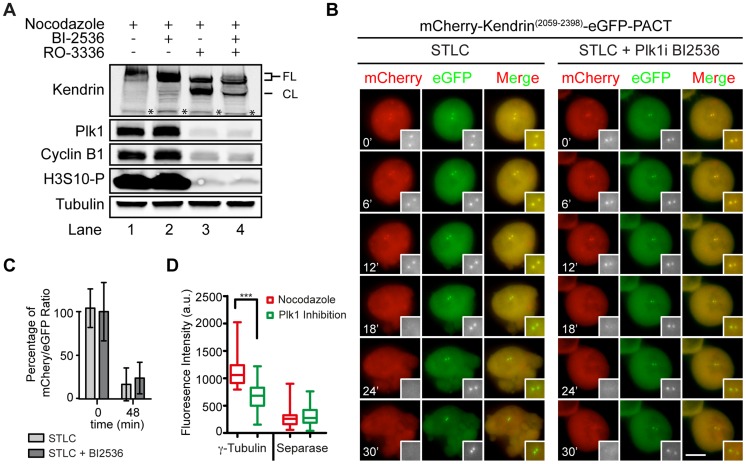
Figure 5. Plk1 regulates substrate cleavage of Scc1 but neither the activity of separase nor the cleavage of kendrin.
(A) The level of cyclin B1 and cleaved kendrin do not change upon Plk1 inhibition. FL indicates the non-cleaved kendrin and CL the cleaved kendrin product. The asterisk indicates protein bands that are unspecifically recognized by the anti-kendrin antibody. (B) mCherry-Kendrin(2059-2398)-eGFP-PACT stably expressing HeLa cells were analyzed for the cleavage of the sensor upon Plk1 inhibition. Experiment was performed as described in Figure 4A. The two-fold magnifications on the bottom right of the figures highlights the centrosomes. The scale bar represents 10 µm. (C) The quantification of (B). mCherry/eGFP ratio at centrosomes was quantified just after (t = 0) and 48 min after (t = 48) addition of the Plk1 inhibitor BI2536. Data were normalized to the average mCherry to eGFP ratio at t = 0 min. (D) The levels of γ-tubulin and Espl1 signals at the centrosome were plotted using Whisker-Box plot after Plk1 (BI2536) inhibition. The level of Espl1 did not change upon Plk1 inhibition although the γ-tubulin signal declined compared to nocodazole treatment as a control to maintain the cells at prometaphase. Statistical analysis was performed with one-way ANOVA (*** represents p<0.001). N≥30, Error bars: SD.

