Figure 6.

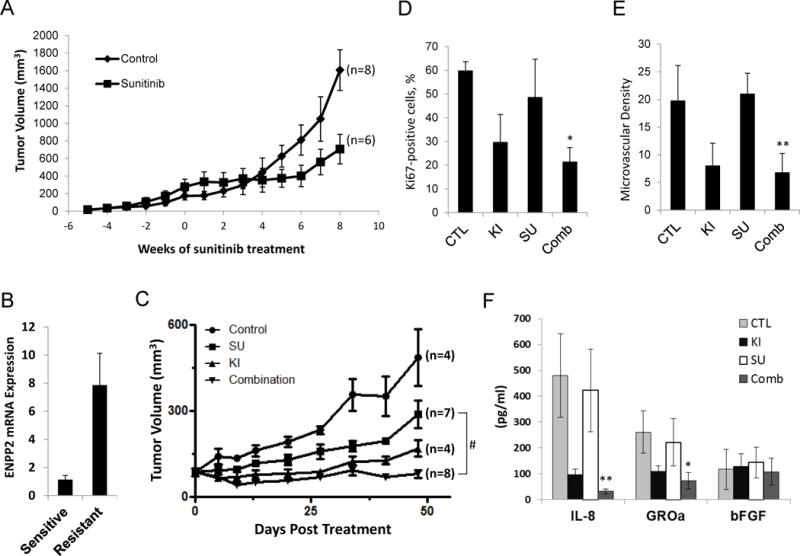
Effects of Ki16425 treatment on RCC xenograft models with acquired resistance to sunitinib. A, establishment of RCC xenograft models with the acquired resistance to sunitinib. BALB/c nude mice were given s.c. injections of UMRC3 cells in both flanks. Mice were treated daily with sunitinib (40 mg/kg per day) by oral gavage, and tumor size was measured twice per week. Tumor growth curve was shown as averaged tumor size. The treatment began at time point 0. The individual tumor growth was shown in Supplemental Figure 4. B, endothelial cells from xenograft tumors were isolated using anti-CD31-coated magnetic beads when tumors reached the sensitive or resistant phase. Total RNA was prepared and real-time RT-PCR was performed to assess the expression level of ENPP2. Data are expressed as mean ± S.D. of three replicates and are representative of two separate experiments. C, UMRC3 xenograft models were generated, randomized into four groups and given water (Control), sunitinib (SU) (40 mg/kg per day) by oral gavage, Ki16425 (KI) (20 mg/kg per day) subcutaneously, and a combination of sunitinib (20 mg/kg) plus Ki16425 (10 mg/kg). Tumor volume was calculated at the indicated time point and expressed as the mean ± S.D. (Student’s t-test; #, P<0.001 on day 48 after treatment). D–E, tumors were fixed and embedded in paraffin after 48 days of treatment. Tissue sections were subjected to immunohistochemical analysis by using monoclonal antibodies against the nuclear Ki67 antigen and CD34. The Ki67 positivity (D) and microvascular density (E) were calculated from four independent tumor sections per group and expressed as the mean ± S.D. (Student’s t-test; *, P<0.05; **, P<0.01 compared with sunitinib alone). F, secretion of tumor-derived cytokines in serum from mice of each treatment arm was measured. Data are presented as mean ± S.D. (Student’s t-test; *, P<0.05; **, P<0.01 compared with sunitinib alone). Results are representative of two independent experiments.
