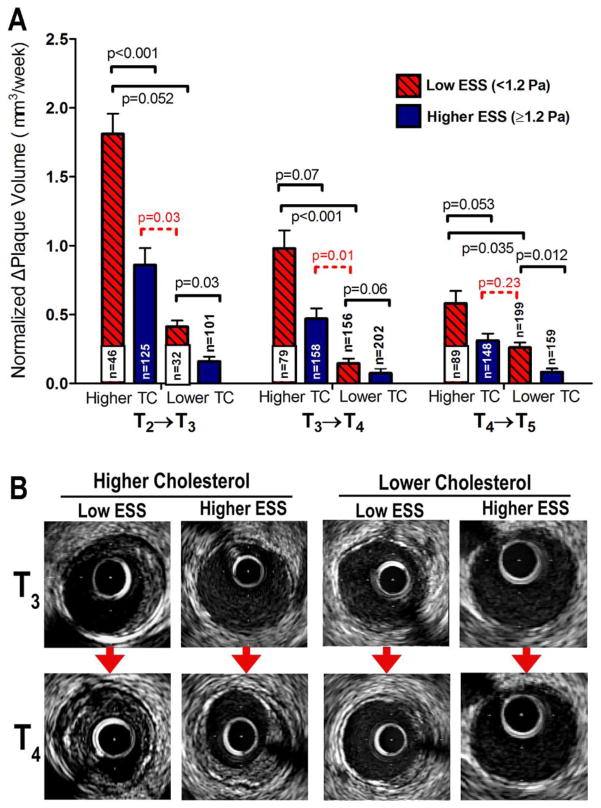
Figure 1.
(A) Time-normalized change of plaque volume (nΔPV), for all intervals between consecutive time-points (T2→T3; T3→T4; T4→T5), in segments stratified according to low ESS (<1.2Pa) vs. higher ESS (≥1.2Pa) at each time-point and according to higher-TC vs. relatively lower-TC. Note that segments only from the 36-week cohort (n=304) were analyzed at interval T2→T3, whereas segments from both the 30-week and 36-week cohort (n=595) were analyzed at intervals T3→T4 and T4→T5. (B) Representative examples of plaque progression by IVUS between consecutive time-points (T3→T4) in segments stratified by local ESS and systemic TC categories.

