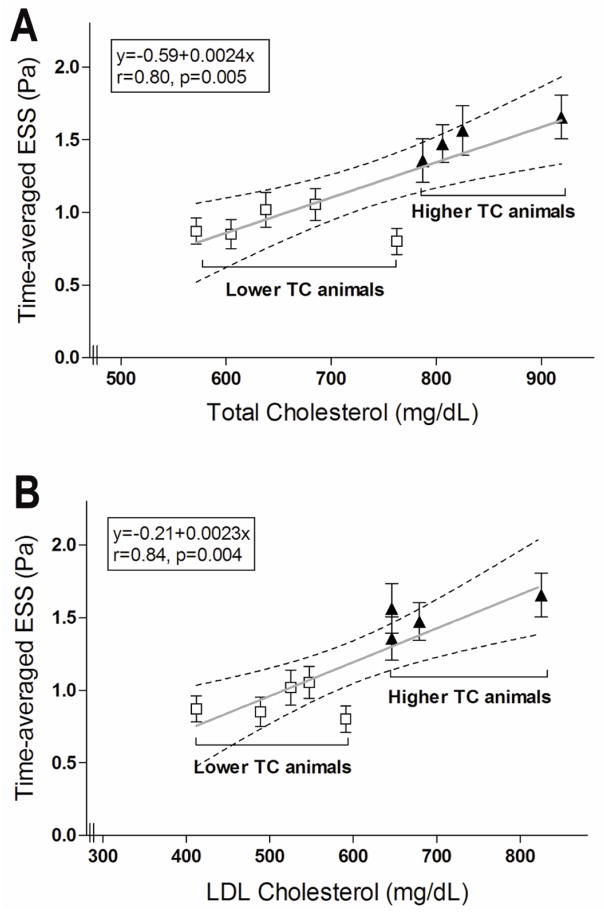
Figure 3.
The time-averaged ESS in segments that culminated in significant plaque by IVUS (defined as maxIMT≥0.5mm by IVUS at follow-up) in each animal is related to the total cholesterol (A) and the LDL-cholesterol levels (B) in the corresponding animal. Dashed lines represent 95% confidence intervals for the linear regression lines.

