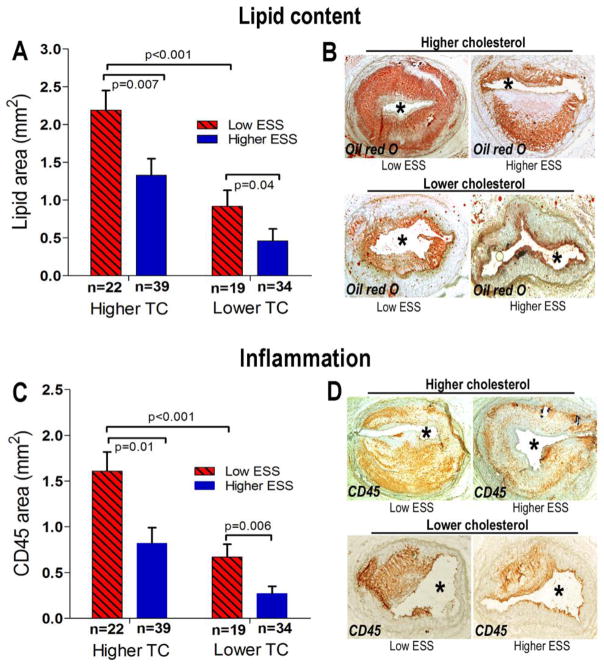
Figure 5.
Quantitative analyses of lipid accumulation (A) and CD45-positive leukocyte infiltration (C), and representative examples of Oil-red-O staining (B) and CD45 immunostaining (D) in segments stratified according to time-averaged local ESS (low ESS <1.2Pa vs. higher ESS ≥1.2Pa) and the higher vs. relatively lower cholesterol levels of the corresponding animal.

