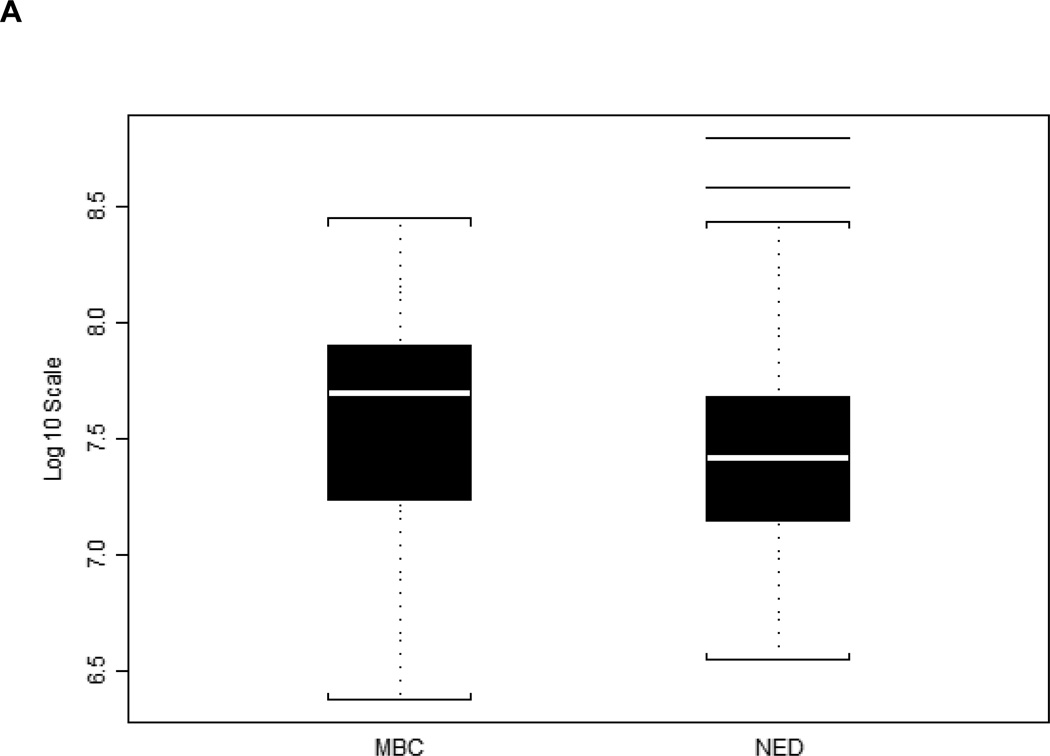
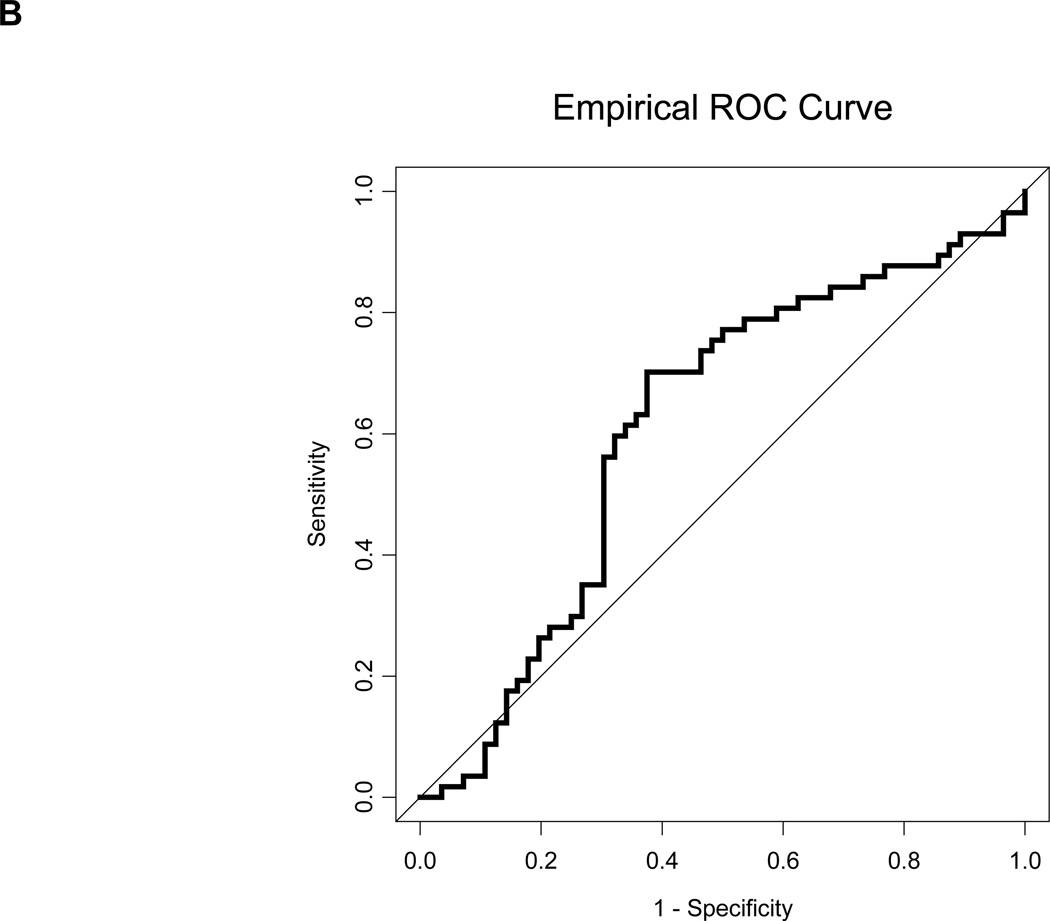
Figure 5.
Serum HERV-K10 gag mRNA expression data of a repeat analysis of 113 additional matched samples. A, Boxplots depicting HERV-K gag mRNA mean copy number values for 56 patients with distant metastases (MBC) and 57 patients without distant metastases (NED). The MBC patients again had higher HERV-K mRNA expression on average, and the difference was again significant by the Wilcoxon rank-sum test, with p = 0.041. B, ROC curve for HERV-K gag for the repeat analysis. The AUC = 0.611 +/− 0.053.


