
Fig. 2.
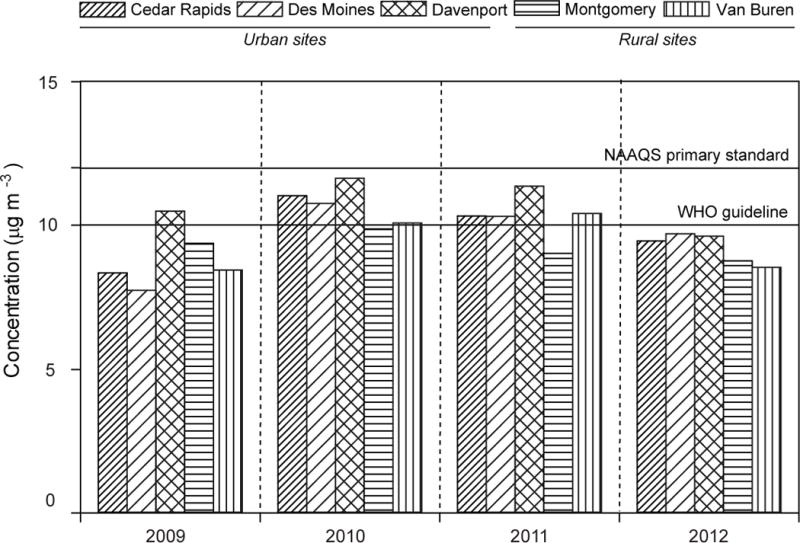
Annual average PM2.5 concentrations at five locations in Iowa, with Cedar Rapids, Des Moines, and Davenport representing urban areas and Montgomery and Van Buren representing rural areas.
Official websites use .gov
A
.gov website belongs to an official
government organization in the United States.
Secure .gov websites use HTTPS
A lock (
) or https:// means you've safely
connected to the .gov website. Share sensitive
information only on official, secure websites.
Annual average PM2.5 concentrations at five locations in Iowa, with Cedar Rapids, Des Moines, and Davenport representing urban areas and Montgomery and Van Buren representing rural areas.