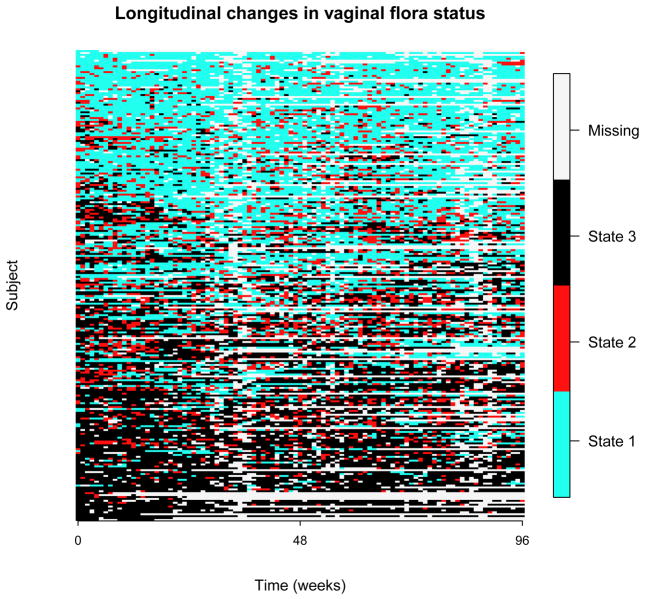
Figure 1.
Longitudinal changes in vaginal flora states. Follow-up time is marked on the x axis. Each row represents the status of vaginal flora of an individual over 96 weeks. Blue, red, and black colors correspond to BV states 1, 2, and 3, respectively, and white spots represent missing measurements (summarized in the right bar).

