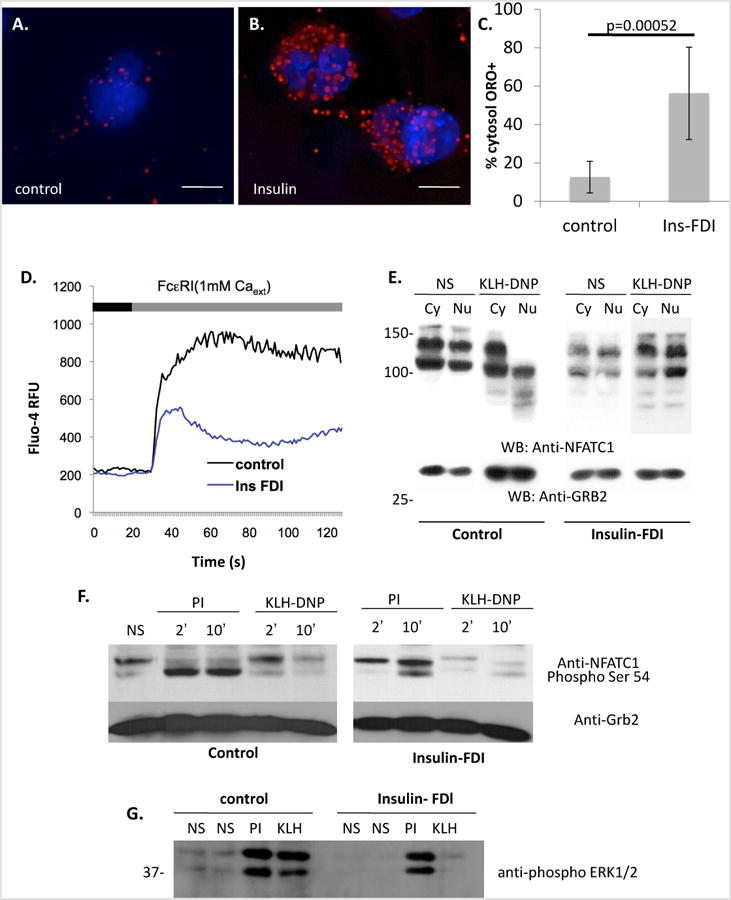
Figure 1. Induced lipid body accumulation alters calcium responses and downstream signaling pathways in a RBL2H3.

A-C. Induction of lipid body accumulation by chronic insulin exposure. Extended depth of focus (EDF) projections of deconvolved epi-fluorescently imaged z stacks of unstimulated (A) and 6d insulin-exposed (B) RBL2H3 stained with DAPI and Oil Red O (ORO). C. Percentage of cytosolic volume of control and insulin-treated RBL2H3 occupied by ORO-postitive LB structures. Z-stacks of 14 control and 14 treated cells were images and a binary thresholds were placed on the reconstructed images to estimate cell volume, nuclear volume and total volume of ORO-positive structures. Percentage of cellular volume (excluding nucleus) occupied by LB was calculated and is shown here. D. Population-based calcium assay of control and insulin-treated cells (6d) stimulated with IgE and KLH-DNP (200ng/ml) to cross-link the FcεRI. Antigen (black bar) was added after 30s establishment of baseline Fluo-4 signal (grey bar). E. Decreased calcium-dependent dephosphorylation and nuclear localization of NFATC1 in antigen stimulated steatotic cells. NFATC1 phosphorylation status was assessed by Western blot of cytoplasmic and nuclear lysates. NFATC1 phospho-form is lower mobility (higher apparent MW) band while dephospho-form is higher mobility (lower apparent MW) band. These data primarily reflect phopshorylation events occurring within the serine regulatory region (SRR). Calcium-dependent dephosphorylation and nuclear import of NFATC1 was stimulated by FcεRI crosslinking to a lesser degree in Insulin-treated than control cells. Anti-Grb2 Western blot is included as a loading control. F. Comparison of Ser-54 NFATC1 in control and 6d insulin exposed cells. Calcium-dependent phosphorylation of Ser54 was initiated pharmacologically (PMA/Ionomycin, PI) or via FcεRI crosslinking (KLH-DNP). Ser 54 phosphorylation is visible in both the SRR-phospho and SRR-dephospho forms, reflected as different mobility bands. G. Comparison of ERK1/2 phosphorylation in control and 6d insulin exposed cells. Calcium-dependent phosphorylation of ERK1/2 was initiated pharmacologically (PMA/Ionomycin, PI) or via FcεRI crosslinking (KLH-DNP). Each lane contains 10 μg protein confirmed by BCA assay. Steatosis in >80% of the cell population was confirmed in parallel with each experiment microscopically. All experiments n of at least 3.
