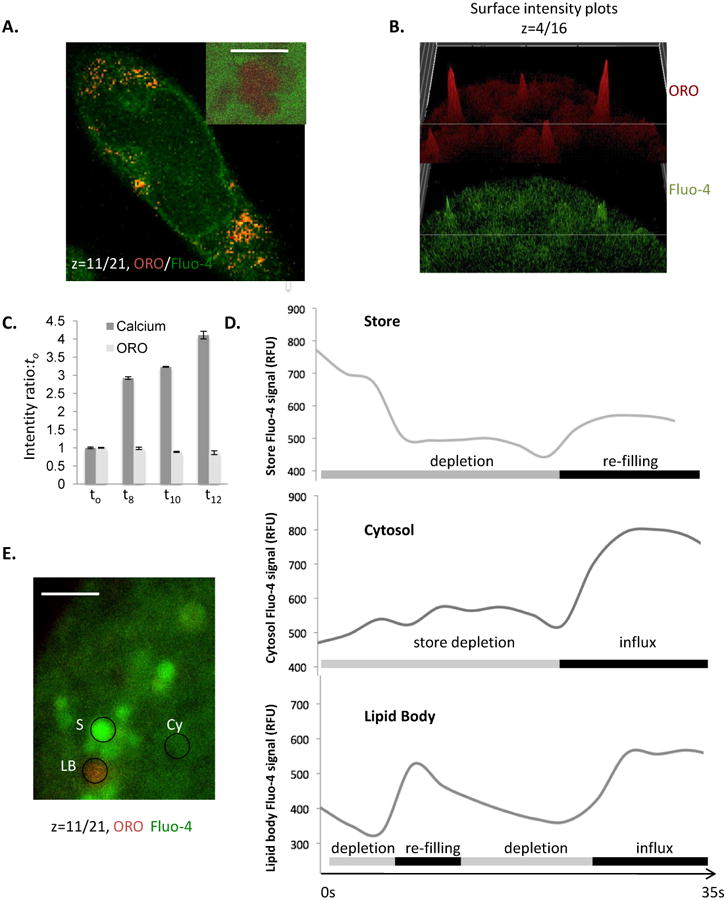
Figure 3. Live cell concurrent imaging of Fluo-4 and Oil red O.

A. Confocal z disc (main panel) of Fluo-4/ORO co-staining in live cells, demonstrating simultaneous imaging of LB and intracellular free calcium levels. Scale bar is 10 microns. Inset shows high resolution image of large lipid body cluster (scale bar is 0.5 microns) where a single z-disc has bisected the LB cluster, again co-stained with ORO and Fluo-4 in a live cell. B. Intensity surface projections of ORO (upper panel) and Fluo-4 (lower panel) fluorescence intensity of a diverse set of LB in RBL2H3. Panels are presented to illustrate that LB may show intense staining in one or both of these fluorescence channels, indicating that some but not all LB are Fluo-4/Calcium enriched relative to others and the cytosol. C. Intensity ratio of Fluo-4 (calcium) and ORO fluorescence signals normalized to the t0 timepoint and charted at the indicated times (in s) after addition of antigen to the cells. Averaged signals from ROI corresponding to z discs consistently taken at 50% of the maximum cell height of the cell bodies of 55 individual cells were used to calculate these averages prior to normalization. D and E. Averaged Fluo-4 fluorescence intensity profiles for 25 ROI per trace of 1 micron diameter drawn around either apparent calcium stores, cytosol or ORO-positive LB during the first 35s of cellular exposure to FcεRI cross-linking (D). Store (S), Cytosol (CY) and lipid body (LB); exemplar ROI are shown in E.
