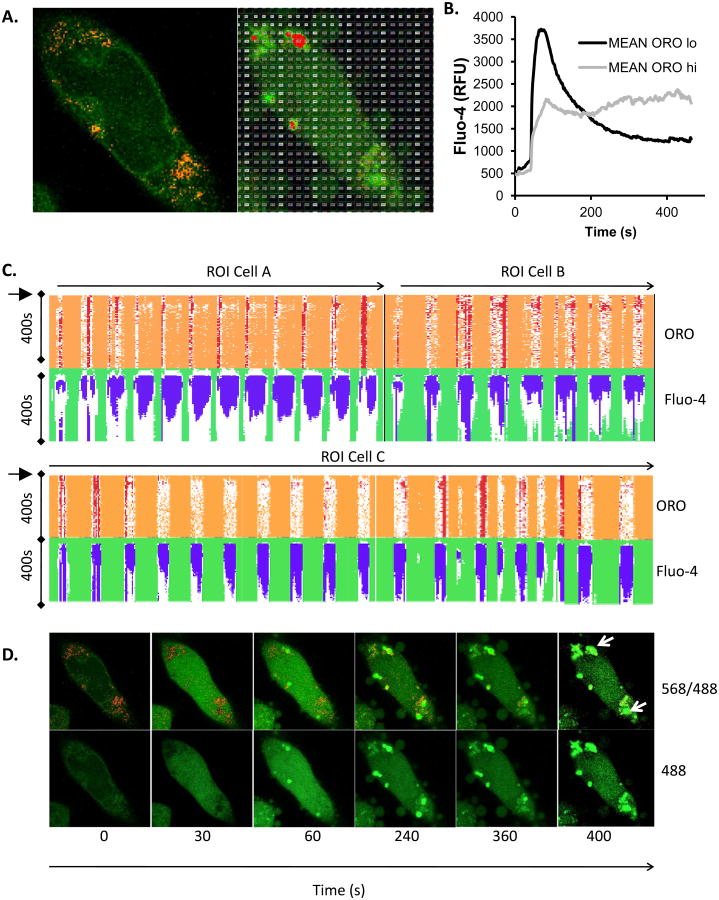
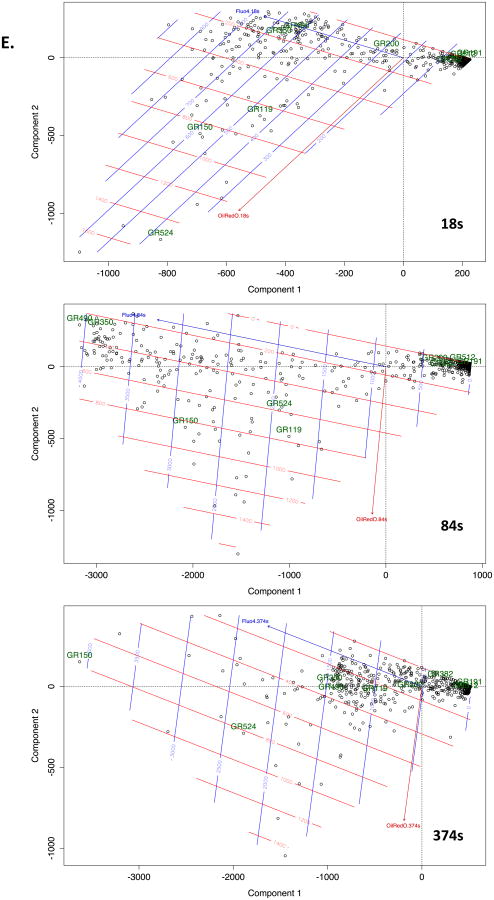
Figure 4. Unbiased analysis of calcium signalling in ORO-positive and ORO-negative subcellular locations.
A. Example of graticule ROI positioning over a single live cell (pre-treated with insulin at 10 μg/ml for 6d to induce LB formation) stained with both Fluo-4 and ORO. Left panel is at 0s and right panel at 300s after stimulation. B. Mean Fluo-4 intensity changes over a 450s time course following antigen stimulation at 20s. Black trace. Averaged signal from graticule ROI within 0- 25th percentile ORO fluorescence intensity (ORO lo). Grey trace. Averaged signal from graticule ROI within 75th-100th percentile ORO fluorescence intensity (ORO hi). C. Conditional formatting visualization of 3 exemplar (A, B and C) cells with ORO and Fluo-4 fluorescence intensities scored over time (vertical) for individual graticules (horizontals). OROhi graticule ROI (see above) were formatted red, Fluo-4 signals in excess of 2 fold over initial intensity were formatted blue. D. Time series of Fluo-4 (488nm) and ORO (568nm) imaging either merged (upper panels) or Fluo-4 alone (lower panels) at the indicated times (in s). Antigen stimulus was added at 20s. Sustained high intensity Fluo-4 signal is notable in areas corresponding to high ORO staining. Each panel is one confocally-acquired z disc and is 12 microns in width. Arrow indicate areas of long term elevation in Fluo-4 fluorescence. E. Multivariate analysis of graticules during three different phases of FcεRI-induced calcium signaling. Principal component analysis (PCA) biplots are shown for 18sec, 84sec, and 374sec that represent pre-stimulated, peak, and sustained phases of calcium signal, respectively. Individual circles represent each graticule (ROI) mapped over the model cell during the stimulation the time course. Species vectors and thin plate splines are mapped across the plot in order to visualize the signal gradients (red = Oil Red O, blue = Fluo-4). The magnitude of the splines is rendered with each smoothing line and the directional magnitude of the vectors follows from the biplot origin to the direction of highest influence. Non-cell graticules (GR191 & GR512), border graticules (GR200 & GR382), cellular non-lipid body graticules (GR350 & GR490) and cellular lipid body graticules (GR119, GR150 & GR524) are labeled in all three time points in order to follow the relationships in those different regions. We expect to see graticules with higher ORO signals to have corresponding higher Fluo-4 signals and for those signals to be maintained after stimulation which would show evidence of a calcium sink. We also expect graticules from similar regions to be plotted closer to each other in the biplots.


