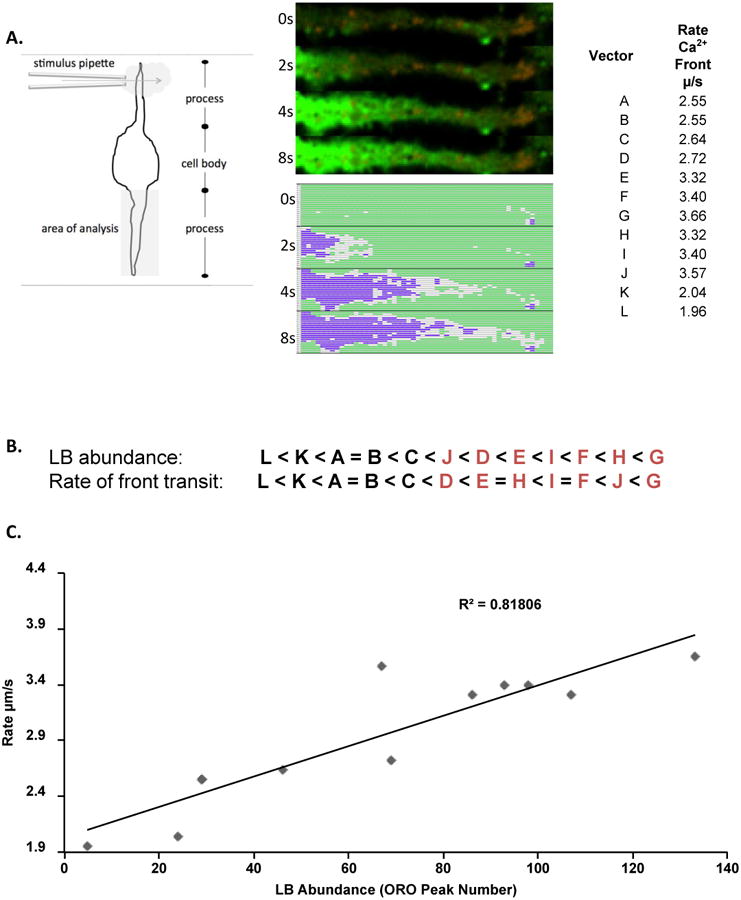
Figure 5. Influence of LB enrichment on progress of a cytosolic calcium signal.

A. Vector-based analysis of calcium signal propagation. Left panel. Schematic of experimental and analysis set-up. Center Panel. Upper panel shows single z disc of cellular process concurrently imaged for Fluo-4 and ORO in a live cell format. Sequential images at 0, 2, 4, and 8s after cessation of antigen application are shown vertically as raw images or conditionally formatted as in Figure 4. For analysis image was divided into longitudinal vectors (designated A-L). Right panel. Measured rates of calcium signal progression. B. Rank order of vectors based on LB abundance (averaged ORO intensity) and rate of calcium signal progression. Letters in red indicate vectors with the highest ranked prevalence of ORO-positive pixels. C. Correlation analysis of LB abundance and rate of signal progression in individual vectors.
