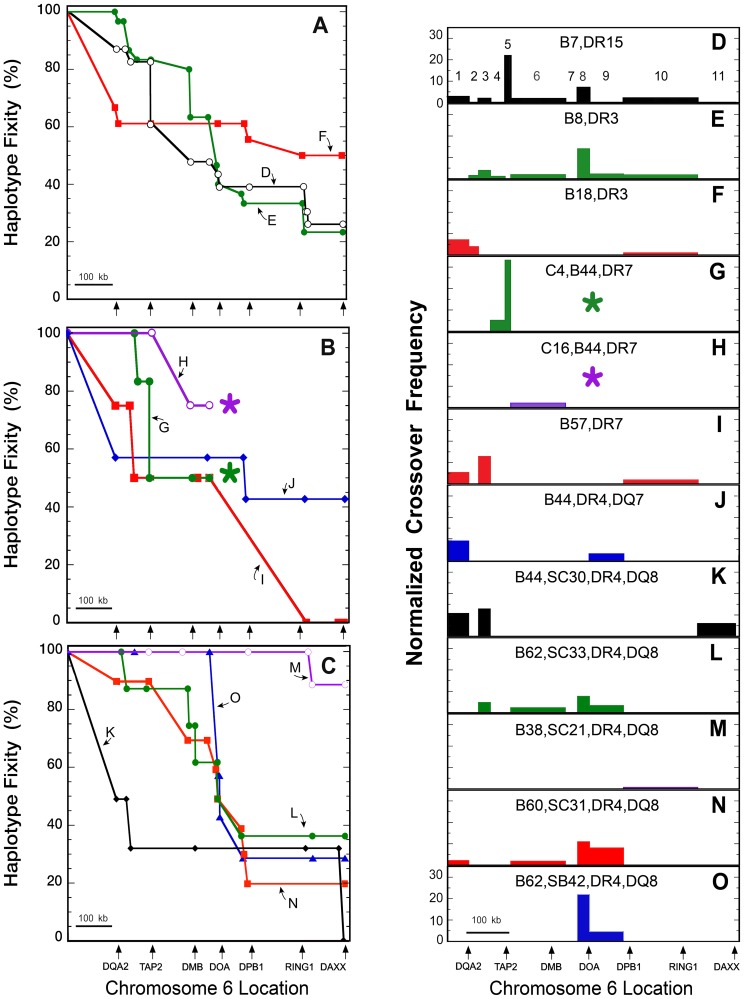
Figure 3. CEH sequence fixity and crossover frequencies from HLA-DQA2 to DAXX.
Chromosomal location is shown to scale on the abscissa and starts at the mid-point between HLA-DRB1 and HLA-DQB1 (A–C) or at HLA-DQB1 (D–O). The locations of several HLA class II and extended class II genes are marked by arrows below Figures 3A–C and 3O. The 11 regions analyzed for normalized crossover frequency (NCF) are enumerated in Figure 3D. The numbers of haplotypes analyzed for each CEH are given in Table 1. Sequence fixities (A) and NCFs (D–F) are shown for the CEHs B7,DR15 (black open circles), (D); B8,DR3 (green closed circles), (E); and B18,DR3 (red squares), (F). Sequence fixities (B) and NCFs (G–J) are shown for the CEHs C4,B44,DR7 (green closed circles), (G); C16,B44,DR7 (purple open circles), (H); B57,DR7 (red squares), (I); and B44,DR4,DQ7 (blue diamonds), (J). Asterisks (*) in Figures 3B, 3G and 3H indicate that sequence fixities and NCFs could not be determined centromeric to the last data points for the two B44,DR7 CEHs. Sequence fixities (C) and NCFs (K–O) for various DR4,DQ8 CEHs are shown. These include the CEHs B44,SC30/SC31 (black diamonds), (K); B62,SC33 (green closed circles), (L); B38,SC21 (purple open circles), (M); B60,SC31 (red squares), (N); and B62,SB42 (blue triangles), (O). NCFs are normalized to the remaining conserved sequences and to 1 Mb relative to the distance over which crossovers were observed, and values are displayed for 11 sub-regions (Table S2).

