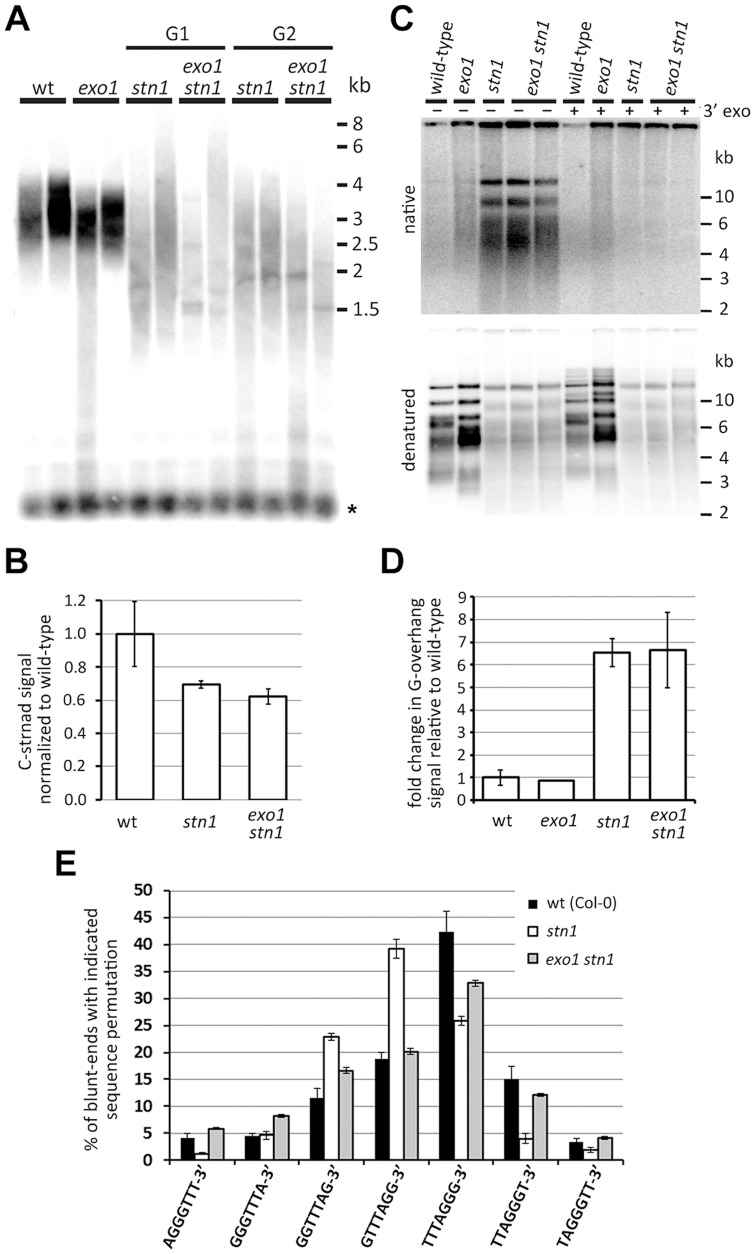
Figure 2. Effect of EXO1 on the structure of STN1-depleted telomeres.
(A) TRF analysis; the asterisks indicate signal from interstitial telomeric DNA. (B) Quantification of the telomeric C-strand by dot-blot hybridization in G1 stn1 and G1 exo1 stn1 plants. Error bars show SDs from two independent samples; the P-value was calculated using a Student's t-test. (C) G-overhang analysis by the in gel hybridization technique. DNA samples pretreated with T4 DNA polymerase to remove 3′G-overhangs are indicated (3′ exo). The gels were first hybridized under nondenaturing conditions (top panels) and then denatured and hybridized again (bottom panels). (D) Quantification of G-overhang signals from a native gel. Error bars represent SDs from three (wt) and four (stn1; stn1 exo1) independent samples. (E) Frequency of telomeric sequence permutations forming the termini of blunt-ended telomeres. Error bars indicate SDs from five (wild-type) or four (stn1, exo stn1) biological replicates. Wild-type data are from [31].

