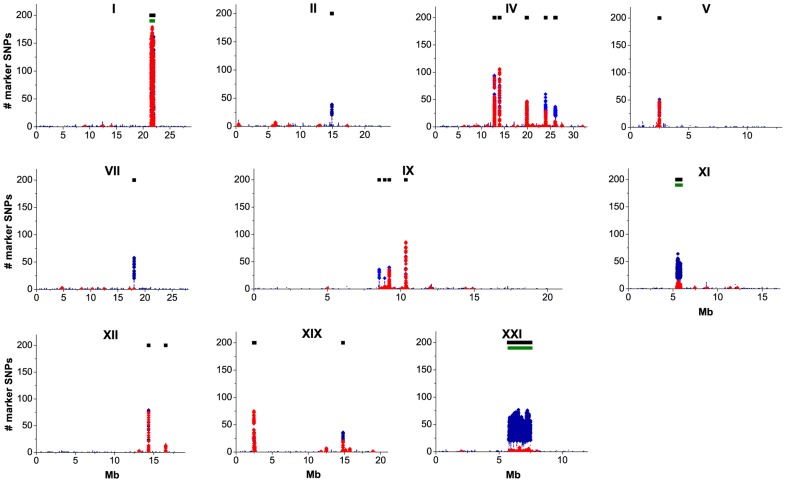
Figure 2. Distribution of SNPs that distinguish the marine and freshwater populations along the G. aculeatus genome.
For each chromosome carrying a DI of marker SNPs, the horizontal axis shows the position along the chromosome in Mb and the vertical axis shows, for 10 Kb frames, the numbers of marker SNPs under the strong (red) or weak (blue) criterion. To reduce clutter, only every 1000th frame is displayed, and the numbers of weak marker SNPs below 20 are represented by small dots. Black bars identify DIs of marker SNPs, and green bars at chromosomes I, XI and XXI underlie known inverted genome segments.

