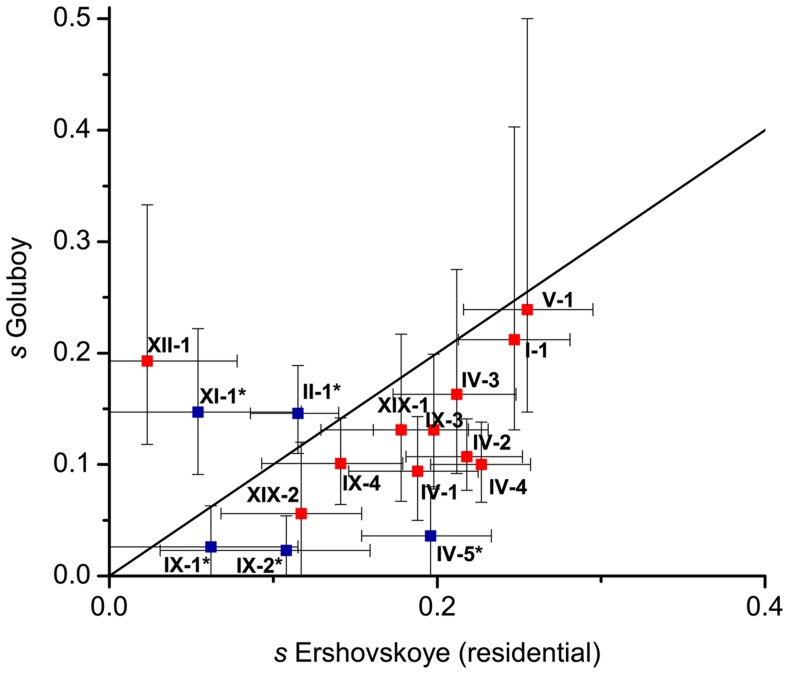
Figure 5. Selection coefficients at DIs estimated from Lake Ershovskoye and Quarry Goluboy.
Red, DIs identified under the strong criterion; blue, DIs identified under the weak criterion. Three DIs are not shown: VII-1 and XXI-1, which had inferred s below 0 in one of the populations; and XII-2, for which s at Quarry Goluboy could not be inferred reliably due to near-fixation of the freshwater allele (Table 2). Whiskers correspond to values of s inferred from mean±st. dev. of allele frequency change.

