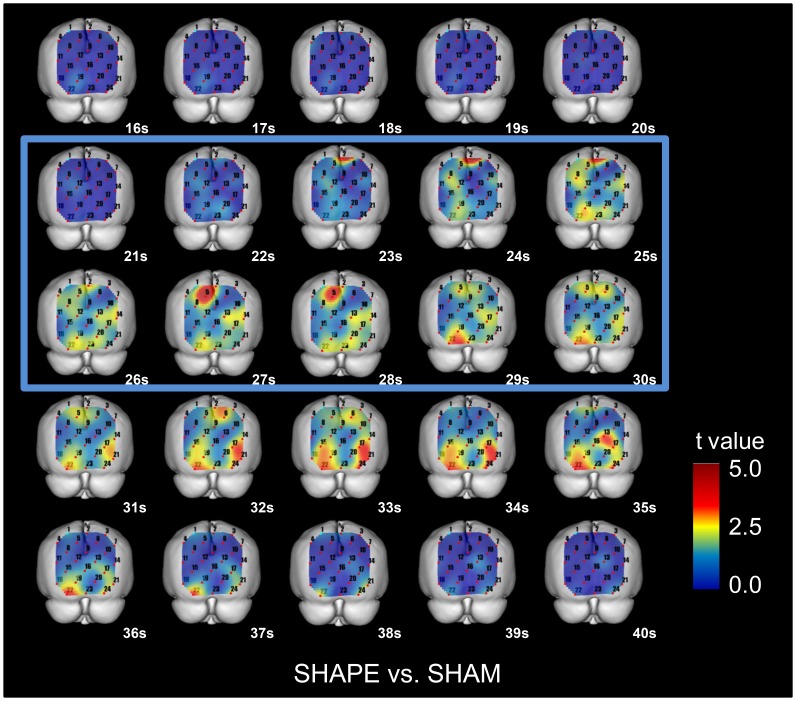
Figure 5. Cross-sectional statistical topographies showing differences in oxygenated-hemoglobin concentrations ([oxy-Hb]) between SHAPE and SHAM sessions.
The values for [oxy-Hb] during the task period of the SHAPE session were significantly increased (p<0.05, paired t-test) as compared to the SHAM session in the posterior parietal cortex (BA7), extrastriate cortex (BA18, 19), and striate cortex (BA17).

