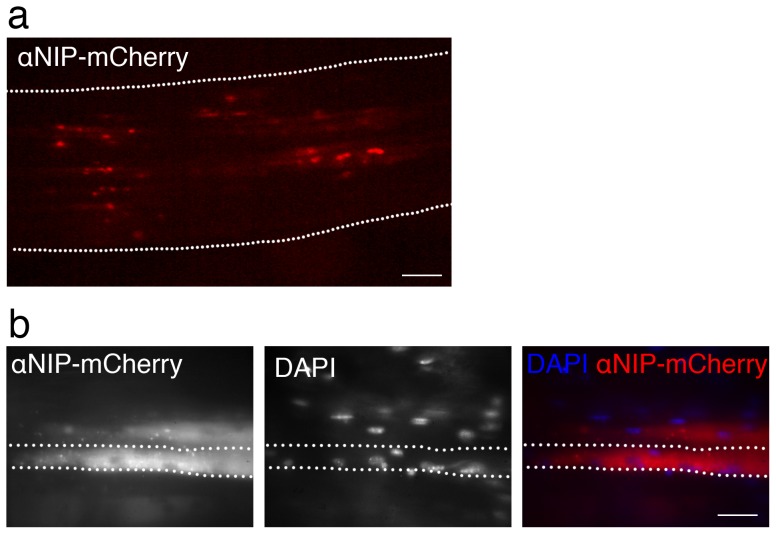
Figure 2. Muscle fibers transfected with αNIP-mCherry visualized in vivo in mice.
DNA encoding αNIP-mCherry was injected into the soleus muscle followed by EP. One day later, the dermis was opened and mCherry (red) indicative of vaccibody expression was visualized by fluorescence microscopy of live muscle in vivo in anesthetized BALB/c mice. (a) Fluorescence microscopy of longitudinal, mid section of soleus muscle. The muscle belly boundary is indicated by dotted lines. Scale bar, 1 mm. (b) Fluorescence microscopy of two transfected muscle fibers. The dotted lines indicate the boundaries of one muscle fiber. DAPI was added to the muscle surface for staining of the nuclei. Scale bar, 50 µm.

