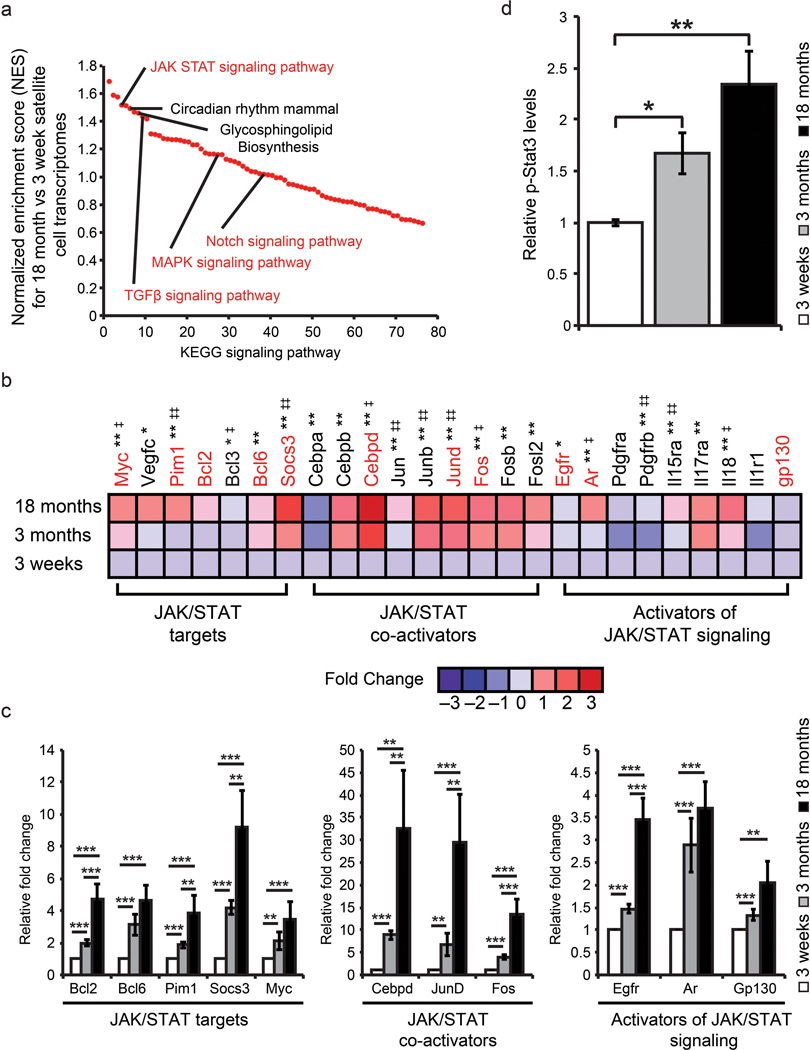
Figure 2.
The transcriptional profile of adult satellite cells is enriched for JAK/STAT signaling pathway members and interactors. (a) Comparison between genes enriched (>2 fold) in adolescent versus older adult satellite cells based on KEGG signaling pathway enrichment. Signaling pathways are ranked based on their normalized enrichment score (NES). Signaling pathways connected with skeletal muscle regeneration are highlighted in red. (b) Fold changes based on Log2 transformed RMA values from adolescent, young adult and older adult satellite cells were used to generate global ratio heat maps. Red indicates genes that increase in expression while blue represents a decrease. * Designates significance between adolescent and young adult where * p < 0.05, ** p < 0.01. ‡ Designates significance between young adult and older adult where ‡ p < 0.05 ‡‡ p < 0.01. Genes highlighted in red are validated by QPCR in panel c. Data represents pooled replicates of adolescent (n=5), young adult (n=8), older adult (n=8) conducted in biological triplicate. (c) QPCR validation of microarray data supports transcriptional changes observed between adolescent, young adult and older adult satellite cells. Data are presented as the mean ± SEM of 3 biological replicates of freshly sorted satellite cells normalized to GAPDH. (d) Quantification of p-Stat3 protein expression from age-related satellite cell samples (Supplementary Fig. 3f) normalized to Hsp70 protein expression to account for loading. Data represent the mean ± STD of 3 biological replicates (n=3). * p < 0.05, ** p < 0.01.

