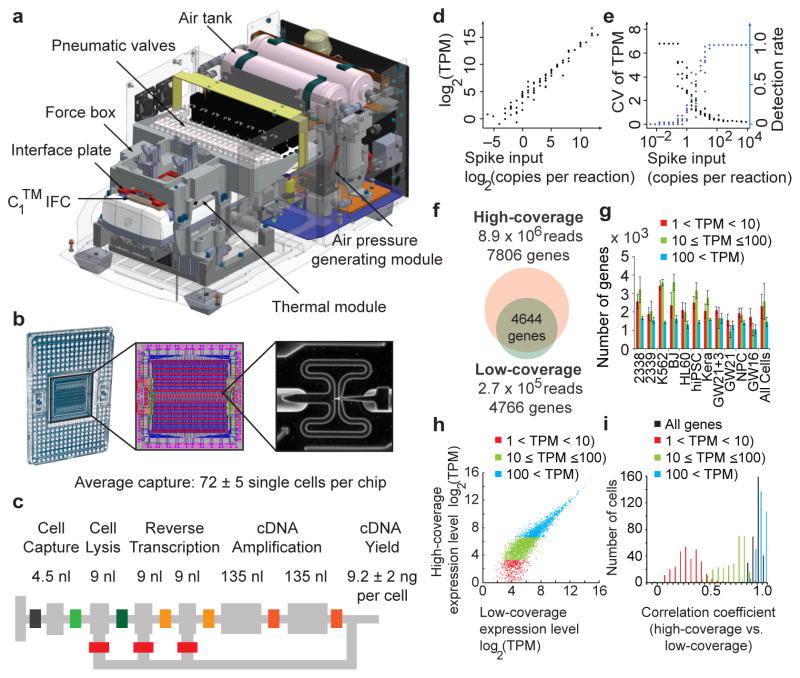
Figure 1.
Capturing single cells and quantifying mRNA levels using the C1™ Single-Cell Auto Prep System. (a) Key functional components of the C1™ System are labeled, including the pneumatic components necessary for control of the microfluidic integrated fluidic circuit (IFC) and the thermal components necessary for preparatory chemistry. (b) Left panel- the complete IFC with carrier; reagents and cells are loaded into dedicated carrier wells and reaction products are exported to other dedicated carrier wells. Middle panel- diagram of the IFC: Connections between polydimethylsiloxane microfluidic chip and carrier (pink circles), control lines (red), fluidic lines for preparatory chemistry (blue), and lines connecting control lines (green). Right panel- a single cell captured in a 4.5 nL capture site; there are 96 captures sites per IFC. The average single cell capture rate was 72 ± 5 cells (mean ± s.e.m.) per chip (Supplementary Tables 1, 2). (c) Schematic for a C1™ reaction line is shown with reaction line colored light grey and isolation valves in varied colors. All reagents are delivered through a common central bus line (segment of bus line shown on far left). Each reaction begins in the 4.5 nL capture site. Delivery of the lysis reagent expands the reaction to also include the first 9 nL chamber. The reaction is expanded again upon delivery of the reverse transcription (RT) reagent to include the second and third 9 nL chambers. Finally, the two 135 nL reaction chambers are included to provide the larger volume required for the PCR reagents. After the addition of RT reagent, the contents of the reaction line are pumped in a loop using a bypass line (bottom) for mixing and the IFC is then incubated at 42°C for RT. Mixing is repeated after the addition of PCR reagents and thermal cycling is performed. Following preparatory chemistry, each single-cell reaction product exits the chip using a dedicated fluidic path to the carrier (path shown to the right). (d) Sequencing of reaction products from 46 K562 cells at low-coverage (1.7 × 10⁵ reads per cell) reveals that expression level estimates correlate strongly with known copy numbers of input spikes (Pearson’s r = 0.968) from External RNA Controls Consortium (ERCC) RNA Spike-In Control Mix 1 (2.8 × 10⁴ copies/reaction). (e) The fraction of positive reactions where ERCC transcripts are detected above 1 TPM in single cells and the coefficient of variation for ERCC levels are both plotted versus the spike input amounts. (f–i) Pools of barcoded libraries from 301 cells were sequenced at high coverage by HiSeq® and at low coverage by MiSeq®. (f) In a representative cell, 4644 genes were detected above 1 TPM in both datasets. (g) Graph showing the average number of genes expressed at various levels detected by high coverage sequencing in each cell type (Methods). (h) In a representative cell, expression levels of genes detected in high- and low-coverage datasets were highly correlated (r = 0.91). (i) Histogram of correlation coefficients for all single cells (n = 301). The mean correlation coefficients increased with expression level: 0.25 (1<TPM<10, red), 0.66 (10≤TPM≤100, green), 0.93 (TPM>100, blue) and 0.91 (all genes with TPM>1).

