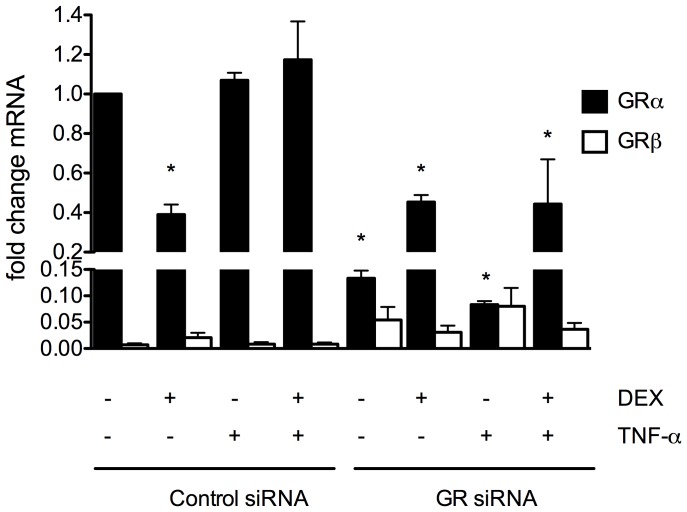
Figure 5. Expression profile of GRα and GRβ mRNA in endothelial cells.
Real time PCR analysis was performed on mouse lung endothelial cells treated as described. Values were normalized to untreated control siRNA GRα levels and represent mean ± SEM for 3 independent samples. Cells were isolated from C57/BL6 mice. *p <0.05 compared to untreated control siRNA GRα levels.

