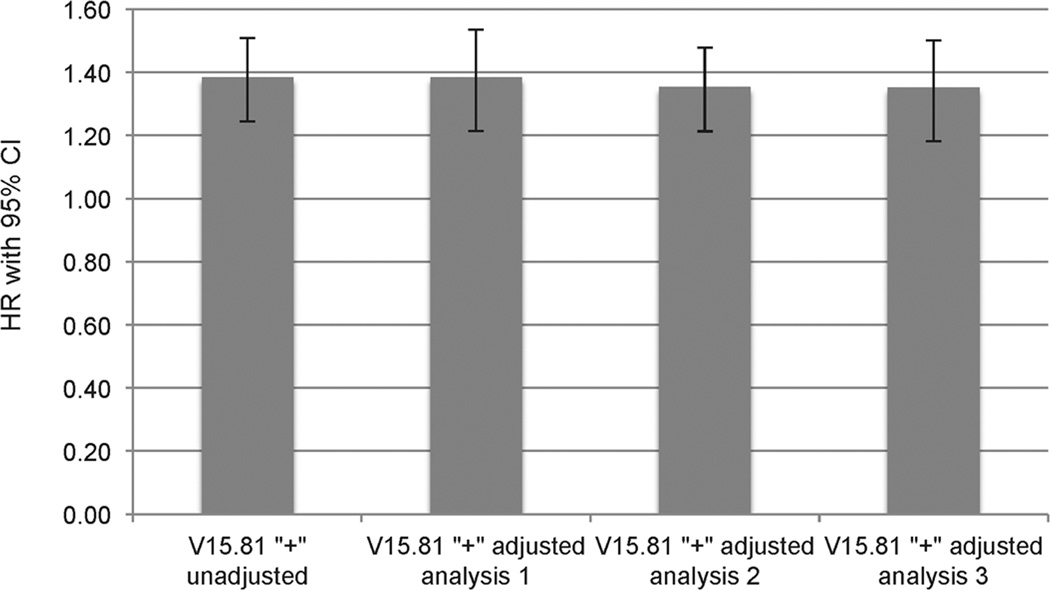
Figure 3.
Hazard ratios (95% confidence intervals) of all-cause mortality of propensity-score matched group with V15.81 code using unadjusted analysis and various adjusted models
Footnotes: V15.81 group served as a reference group for all analyzes; HR, hazard ratio; CI, confidence interval; adjusted analysis 1, all-cause mortality adjusted for the anti-hypertensive drug adherence assessed by the proportion of days covered (PDC); adjusted analysis 2, all-cause mortality adjusted for the mean follow up systolic and diastolic blood pressure (BP), and mean follow up systolic and diastolic BP variability; adjusted analysis 3, adjusted analysis 2, all-cause mortality adjusted for the anti-hypertensive drug adherence assessed by the proportion of days covered (PDC), the mean follow up systolic and diastolic blood pressure (BP), and mean follow up systolic and diastolic BP variability.

