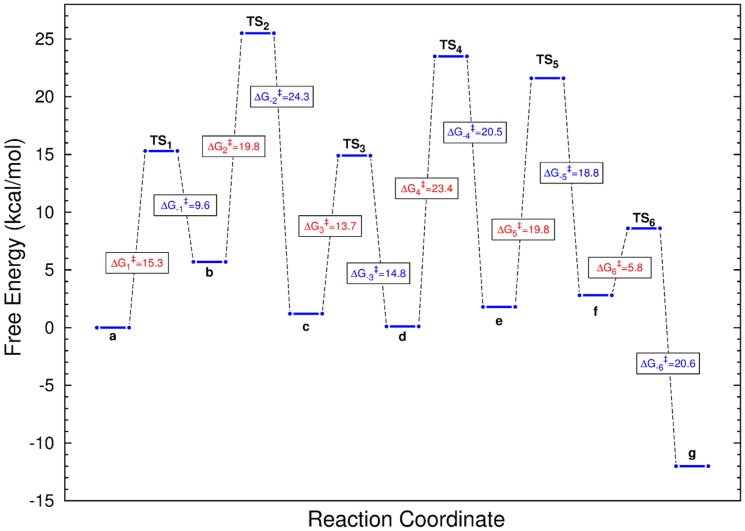
Figure 3. Sketch of the free energy profile for the whole mechanism.
Activation free energies ( ) for all the steps of the mechanism under analysis. Data for the direct reaction are shown in red while those of the reverse reaction are shown in blue. Letters a to g denote the species presented in Fig. 2. The highest point of the profile corresponds to the transition state for the tautomerization of FADH (conversion from b to c of Fig. 2). The largest barrier corresponds to the ring closure into the furanose form (conversion from d to e of Fig. 2).

