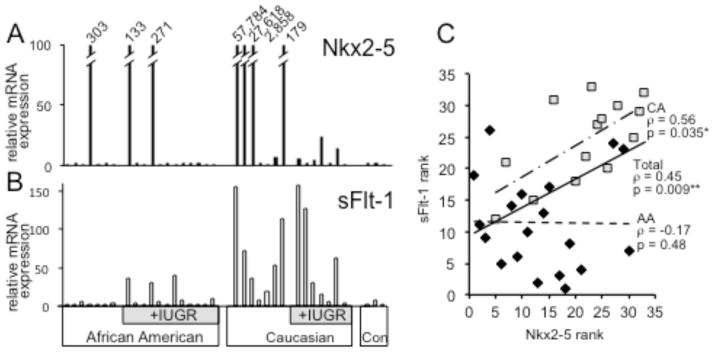
Figure 1. Expression of Nkx2-5 and sFlt-1 mRNA in EOSPE Placentae.

Histogram shows relative fold expression of mRNA for: A. Nkx2-5 and B. sFlt-1 as determined by qPCR in 33 EOSPE placentae and 3 control term placentae. Expression values are normalized to average expression in control term placentae and divided by ethnicity and absence or presence of IUGR. C. Scatter diagram showing Nkx2-5 expression rank (x-axis) vs. sFlt-1 expression rank (y-axis). Rank order values are diagrammed separately for CA (squares) vs. AA (diamonds). *significant (p ≤ 0.05); **highly significant (p ≤ 0.02)
