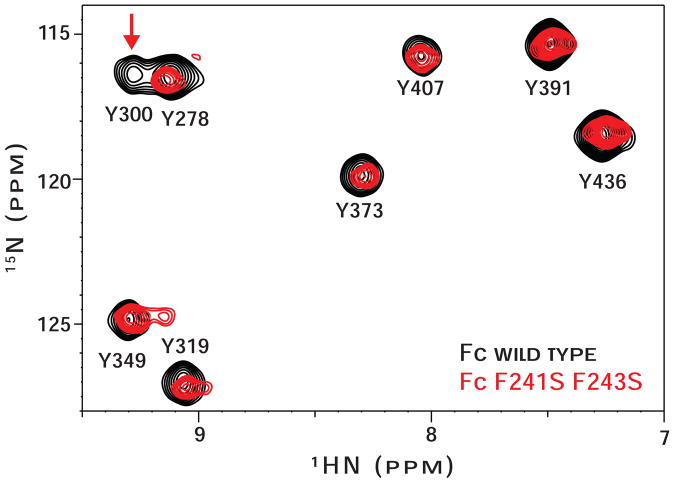
Figure 3. 1H-15N HSQC spectra of (15N-Tyr)-Fc wt (black contours) and (15N-Tyr)-Fc F241S/F243S (red contours) are nearly identical.
Peaks from residues Y300 and Y349 show differences in the mutant spectrum and are highlighted with a vertical arrow. Peak assignments are known (Matsumiya et al., 2007).

